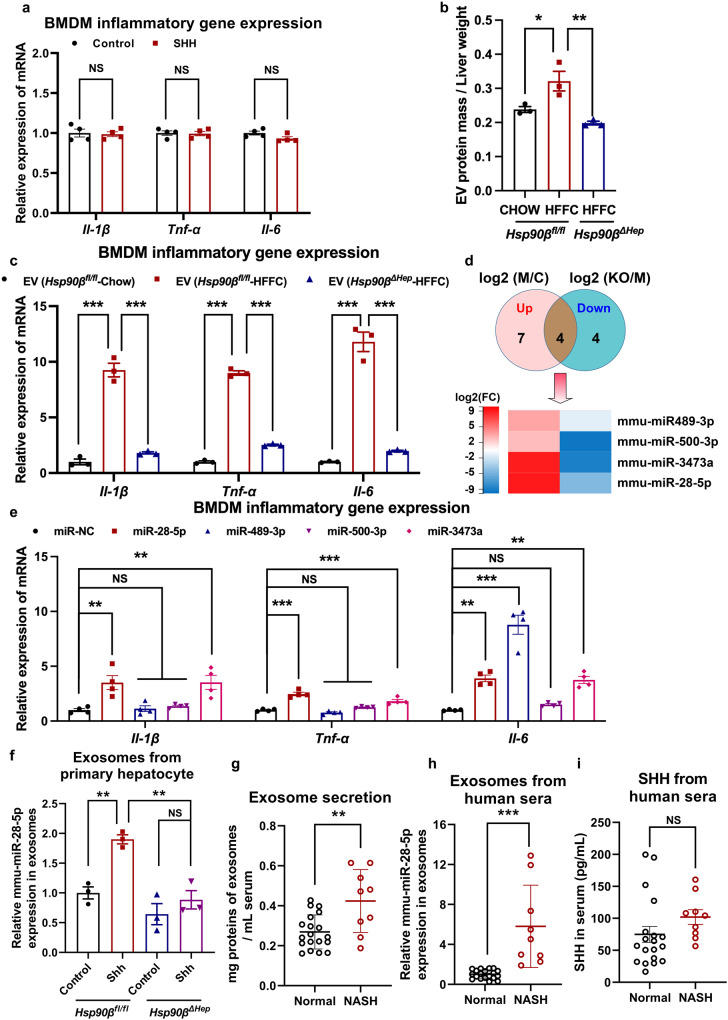
Fig. 6. Shh induces inflammation via miR-28-5p in exosomes.
a BMDMs were treated with 400 pg/μL Shh for 24 h, the expression of inflammatory genes was analyzed by qRT-PCR. n = 4 independent experiments per group. b Relative exosome amount was analyzed in the liver of Hsp90βfl/fl or Hsp90βΔHep mice fed with chow or HFFC diet. (n = 3 mice per group, chow+Hsp90βfl/fl versus HFFC+Hsp90βfl/fl, P = 0.027, HFFC +Hsp90βfl/fl versus HFFC+ Hsp90βΔHep, P = 0.0046). c BMDMs were treated with exosomes derived from livers in Hsp90βfl/fl and Hsp90βΔHep mice fed with chow or HFFC for 24 h, the expression of inflammatory genes was analyzed by qRT-PCR (n = 3 mice per group, for Il-1β, chow+Hsp90βfl/fl versus HFFC+Hsp90βfl/fl, P = 9.7E-06, HFFC +Hsp90βfl/fl versus HFFC+ Hsp90βΔHep, P = 1.8E-05; for Tnf-α, chow+Hsp90βfl/fl versus HFFC+Hsp90βfl/fl, P = 4.8E-08, HFFC +Hsp90βfl/fl versus HFFC+ Hsp90βΔHep, P = 1.0E-07; for Il-6, chow+Hsp90βfl/fl versus HFFC+Hsp90βfl/fl, P = 1.0E-05, HFFC +Hsp90βfl/fl versus HFFC+ Hsp90βΔHep, P = 1.7E-05). d Exosomes were collected from livers of Hsp90βfl/fl and Hsp90βΔHep mice fed with chow or HFFC diet, the expression of exosomes containing miRNA were analyzed by sequencing, the heatmap of miRNA expression was shown. c represented Hsp90βfl/fl mice on a normal chow diet. M represented Hsp90βfl/fl mice on a HFFC diet. KO represented Hsp90βΔHep mice on a HFFC diet. n = 3 mice per group. e BMDM cells were administrated with indicated miRNAs for 24 h, the expression of inflammatory genes was analyzed by qRT-PCR (n = 4 independent experiments per group, for Il-1β, miR-NC versus miR-28-5p, P = 0.0031, versus miR-489-3p, P = 0.99, versus miR-500-3p, P = 0.93, versus miR-3473a, P = 0.0029; for Tnf-α, miR-NC versus miR-28-5p, P = 4.3E-07, versus miR-489-3p, P = 0.42, versus miR-500-3p, P = 0.33, versus miR-3473a, P = 3.5E-04; for Il-6, miR-NC versus miR-28-5p, P = 0.0011, versus miR-489-3p, P = 4.1E-08, versus miR-500-3p, P = 0.84, versus miR-3473a, P = 0.0017). f Exosomes were collected from primary hepatocytes of Hsp90βfl/fl and Hsp90βΔHep mice after the treatment with 400 pg/μL Shh for 48 h, and relative expression of miR-28-5p was analyzed by qRT-PCR (n = 3 mice per group, control+Hsp90βfl/fl versus Shh+Hsp90βfl/fl, P = 0.0061, Shh+Hsp90βfl/fl versus Shh+Hsp90βΔHep, P = 0.0029, control+Hsp90βΔHep versus Shh+Hsp90βΔHep, P = 0.60). g Exosomes were collected from sera of healthy donors or NASH patients, and the relative exosome amount was analyzed (n = 19 participants in normal group. n = 9 participants in NASH group, normal versus NASH, P = 0.0022). h Exosomes were collected from sera of healthy donors or NASH patients, and relative expression of miR-28-5p was analyzed by qRT-PCR (n = 19 participants in normal group. n = 9 participants in NASH group, normal versus NASH, P = 2.4E-05). i Serum SHH concentration of healthy donors or NASH patients (n = 19 participants in normal group. n = 9 participants in NASH group, P = 0.19). Data are presented as mean ± SEM. *P < 0.05, **P < 0.01, ***P < 0.001, NS no significant difference, one-way ANOVA. Source data are provided in the Source Data file.

