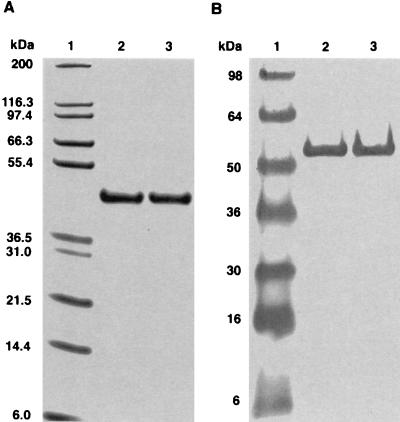
FIG. 3.
(A) Reducing SDS-PAGE of FPLC-purified BoNT/A(Hc) separated on a 10% tricine gel and visualized by Coomassie blue. The gel shows Novex wide-range molecular weight markers (15 μl; lane 1), peak 1 (2 μg; lane 2), and peak 2 (2 μg; lane 3). (B) Western blot analysis of FPLC-purified BoNT/A(Hc) detected with MAb 6E9-11. The blot shows Novex prestained molecular weight markers (15 μl; lane 1), peak 1 (2 μg; lane 2), and peak 2 (2 μg; lane 3).

