FIGURE 2.

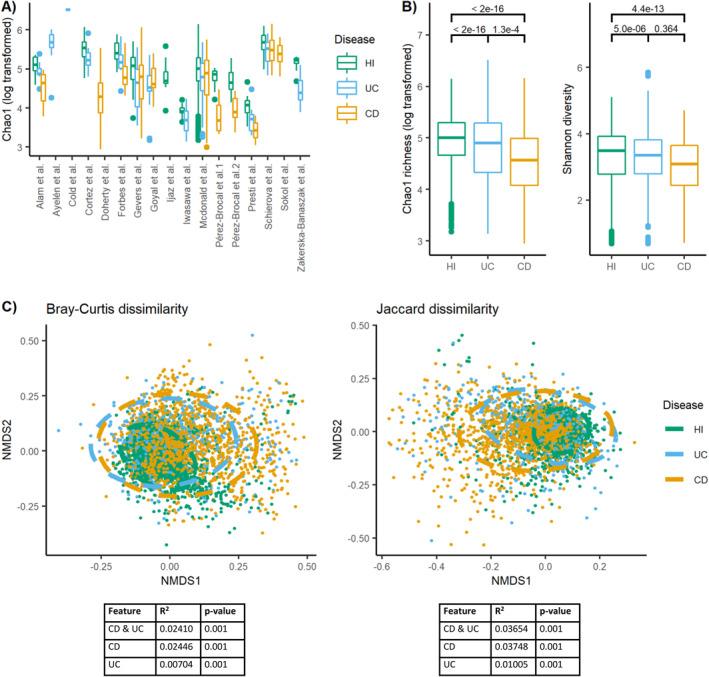
Microbiota diversity is altered in IBD patients versus healthy individuals. (a) The values of Chao1 richness (log transformed) according to IBD disease status within the 17 different study cohorts with available meta‐data visualized using boxplots. If two projects had the same author's name, they were also numbered based on the order presented in Table 1. (b) The values of Chao1 richness (log transformed) and Shannon diversity across all study cohorts as visualized using boxplots and separated by disease status. Numbers above the boxplots display the p‐values of the estimated association. (c) NMDS plots visualizing Bray‐Curtis and Jaccard dissimilarity. Stress Bray‐Curtis = 0.205. Stress Jaccard = 0.196. Ellipses in the NMDS plots are fitted assuming a multivariate t‐distribution. Values below plots represent summary statistics of PERMANOVA analyses of the effect of disease status on the beta diversity measures. Both the combined effect of disease (CD, UC, and healthy individuals) and the separate effect of CD and UC versus healthy individuals are presented. CD, Crohn's disease; HI, healthy individuals; IBD, inflammatory bowel diseases; NMDS, non‐metric multidimensional scaling; UC, ulcerative colitis.
