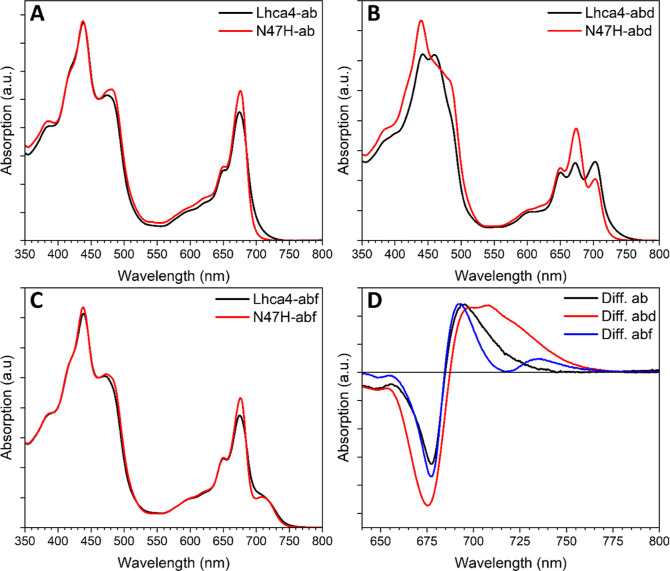
Figure 3.
Comparison of the RT absorption spectra of Lhca4 and N47H complexes. Absorption spectra of Lhca4-ab and N47H-ab (A), Lhca4-abd and N47H-abd (B) and Lhca4-abf and N47H-abf (C). (D) Difference absorption spectra in the Chl Qy region of the Lhca4 complexes minus their N47H mutants. The spectra are normalized to their area in the Qy region (λ = 630–800 nm) scaled to the Chl content as retrieved by the pigment composition analyses (see Table 1).

