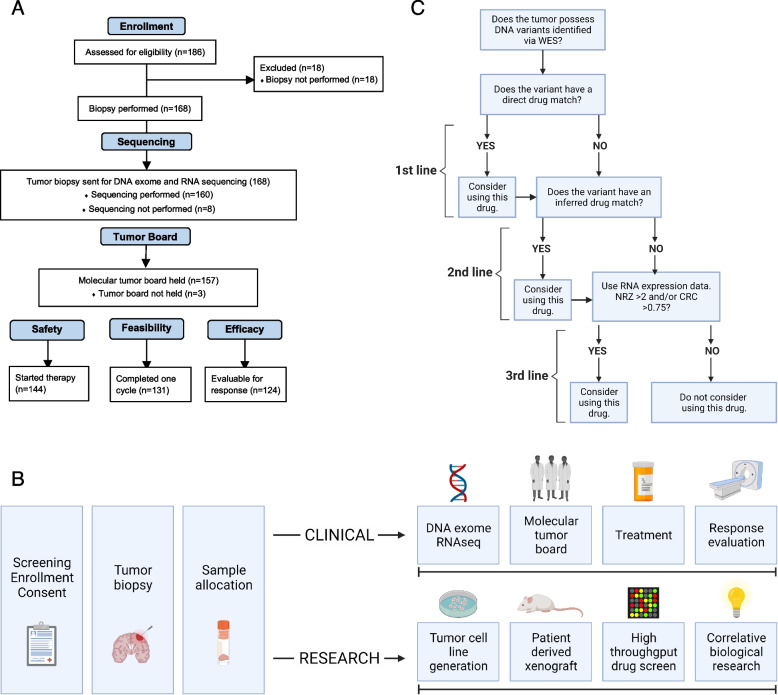
Fig. 1.
A The consort diagram includes the flow of inclusion from enrollment through safety, feasibility, and efficacy criteria. A total of 186 patients were consented for this clinical trial. A total of 144 started MGT, 131 completed one full cycle of MGT, and 124 were evaluable for best response. B The study flow diagram includes the flow of data and samples throughout the trial. Upon consent and enrollment on‑study, patients underwent biopsies to obtain tumor samples in a non‑significant fashion. Tumor samples were then divided between the clinical and research arms and sent to Ashion (CLIA) and POTRL (non‑CLIA) for further evaluation. Tumor-normal whole-exome sequencing (WES) and tumor RNA sequencing were performed at Ashion. Data were analyzed, and the results were used to guide treatment decisions through a molecular tumor board. Patients received therapy according to the molecular tumor board and were evaluated for response per protocol. Tumor samples sent to POTRL were used for cell line and PDX model generation, high-throughput drug screening, and further biological research and analysis. C The drug algorithm represents the flow of decision-making that occurs during the molecular tumor board in order to devise the combination of MGT. Direct or inferred drug matches were first- and second-line options, respectively. However, due to the historically low mutational burden of pediatric tumors, RNA data was primarily used for drug selection. The algorithm was cycled up to four times until the combination therapy treatment plan was decided. *Repeat the algorithm until a three- or four-drug combination has been decided

