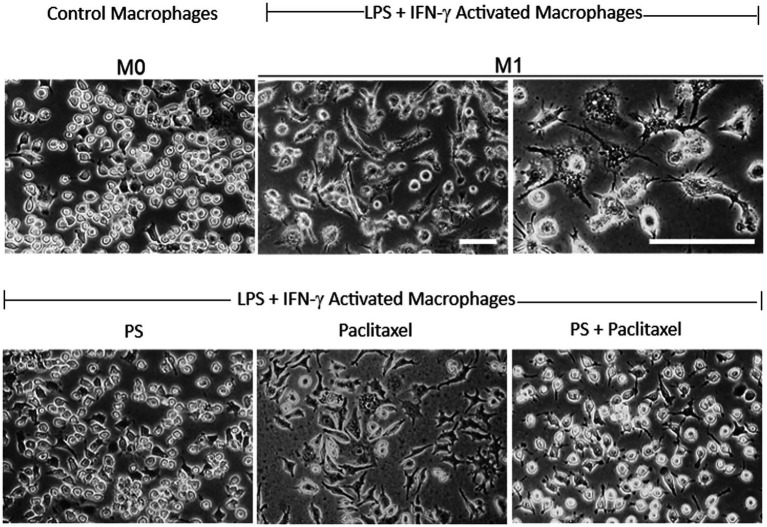
Figure 7.
PS reverses paclitaxel induced macrophage activation. Upper panel: RAW 264.7 macrophages (M0; left) were activated after a 24-h treatment with LPS 1 μg/mL and IFN-γ 40 ng/mL (middle and left), incubated in control media, and photographed on day 4. Lower panel: RAW 264.7 macrophages activated as above, were treated on day 3 with PS (left) or paclitaxel (center) or both (right) and photographed on day 4. All photographs were obtained with inverted light microscopy under phase contrast. Magnification: 20X for all except for 40X in the third picture in the upper panel. Scale bars = 50 μm.

