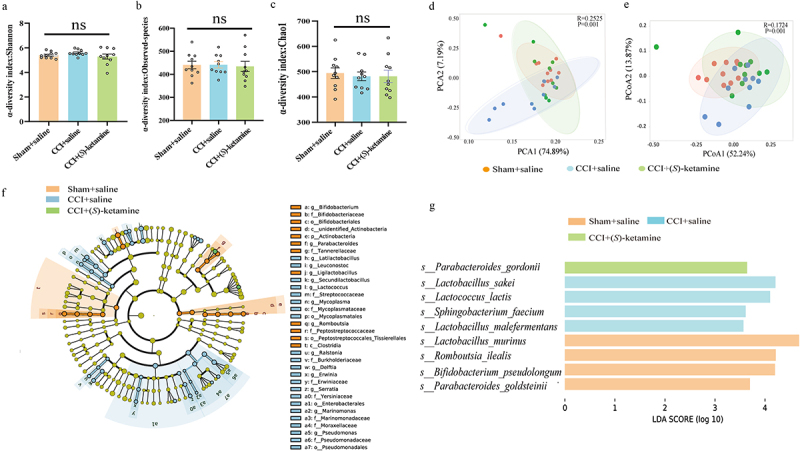
Figure 3.

Composition of gut microbiota and LEfSe analysis. a: Alpha-diversity index of Shannon index (Kruskal-Wallis test, H = 2.511, p = 0.284975). b: Alpha-diversity index of Observed_OTUs (Kruskal-Wallis test, H = 0.4203, p = 0.8105). c: Alpha-diversity index of Chao1 (Kruskal-Wallis test, H = 0.4206, p = 0.8103). d: Principal component analysis (PCA) of beta diversity based on OTU levels (ANOSIM, R = 0.2525, p = 0.001). e: Principal coordinate analysis (PCoA) plot based on unweighted UniFrac distance (ANOSIM, R = 0.1724, p = 0.001). f: Cladogram (LDA score > 3.5, p < 0.05) showing the taxonomic distribution difference among the sham + saline, CCI + saline, and CCI + (S)-ketamine groups, indicating a different color region. The inner-outer radiating circles represent taxonomic levels from phylum to genus. g: histograms of the different abundant taxa based on the cutoff value of LDA score (log10) > 3.5 and p < 0.05, among the three groups; the statistical results are shown in table S1. N = 10/group. LDA, linear discriminant analysis; p, phylum; c, class; o, order; f, family; g, genus; s, species.
