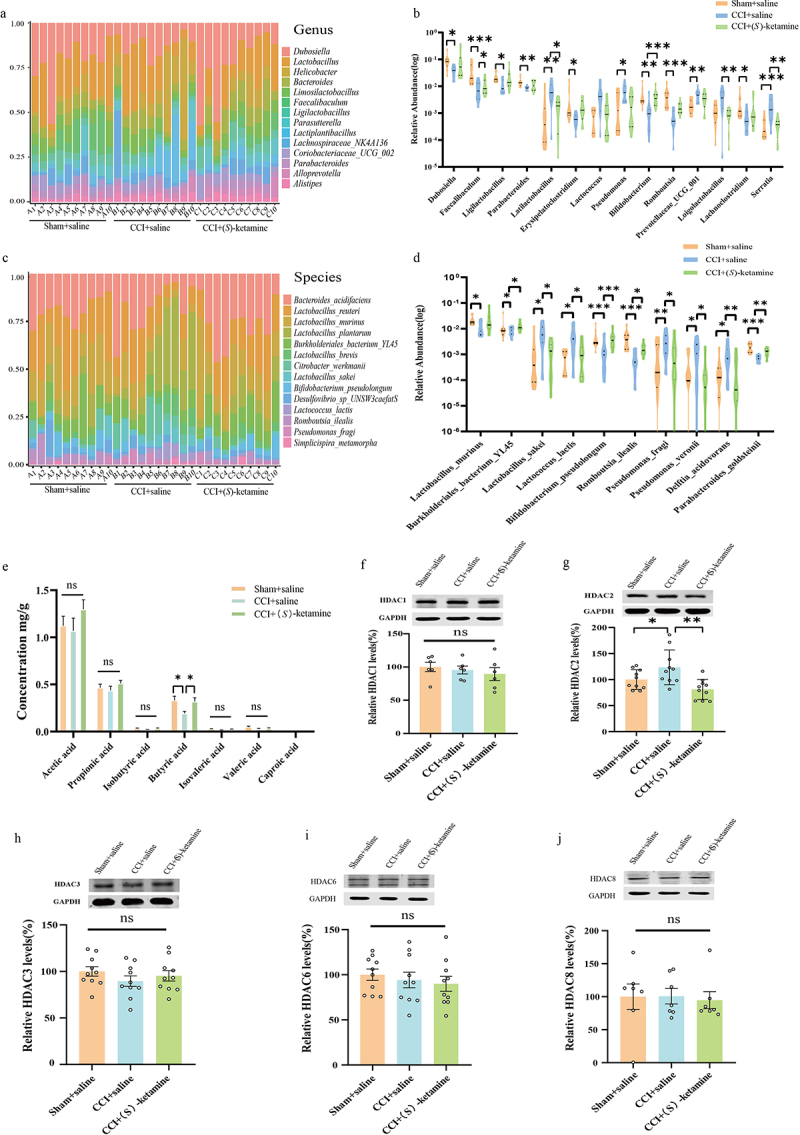
Figure 4.

Alterations in the gut microbiota at different levels, including changes in SCFAs in fecal samples and hippocampal HDACs. a, b: genus. The relative abundance distribution and significantly changed bacteria among the sham + saline, CCI + saline, and CCI + (S)-ketamine groups are shown in table S2. c, d: species. The relative abundance distribution and significantly changed bacteria among the three groups, the statistical results are shown in table S3. e: SCFA levels in fecal samples from sham + saline, CCI + saline, and CCI + (S)-ketamine groups (acetic acid: F(2, 27) = 1.117, p = 0.3420; propionic acid: F(2, 27) = 0.9668, p = 0.031; isobutyric acid: F(2, 27) = 2.455, p = 0.1048; butyric acid: H = 7.235, p = 0.027), isovaleric acid: H = 1.86, p = 0.394; valeric acid: H = 2.419, p = 0.298; caproic acid: H = 6.921, p = 0.031). f: the levels of HDAC1 in the hippocampus (one-way ANOVA: F (2, 15) = 0.4738, p = 0.6316). N = 6/group. g: the levels of HDAC2 in the hippocampus. (one-way ANOVA: F (2, 27) = 7.297, p = 0.003), N = 10/group. h: the levels of HDAC3 in the hippocampus. (one-way ANOVA: F (2, 27) = 0.9130, p = 0.4134), N = 10/group. i: the levels of HDAC6 in the hippocampus. (one-way ANOVA: F (2, 27) = 0.4249, p = 0.6581), N = 10/group. j: levels of HDAC8 in the hippocampus, N = 7/group. (Kruskal-Wallis test, H = 0.7644, p = 0.7016). *p < 0.05; **p < 0.01; ***p < 0.001. HDAC, histone deacetylase.
