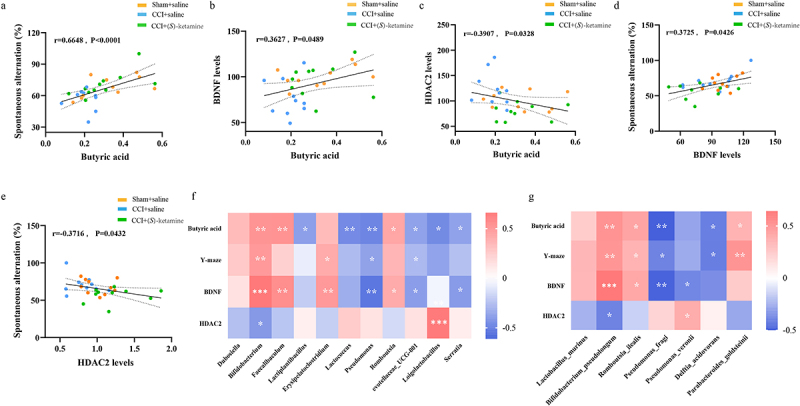
Figure 5.

Correlations between the level of butyric acid, BDNF, or the percentage of spontaneous alternation in the Y-maze test, and the significantly differing relative abundance of bacteria at both the genus and species levels.
a: Correlation between sodium butyrate and percentage of spontaneous alternation in the Y-maze (r = 0.6648, p < 0.0001). b: Correlation between sodium butyrate and BDNF expression in the hippocampus (r = 0.3627, p = 0.0489). c: Correlation between sodium butyrate and HDAC2 expression in the hippocampus (r = 0.3907, p = 0.0328). d: Correlation between BDNF expression in the hippocampus and percentage of spontaneous alternation in the Y-maze (r = 0.3725, p = 0.0426). e: Correlation between HDAC2 expression in the hippocampus and percentage of spontaneous alternation in the Y-maze (r = 0.3716, p = 0.0432). f: Heat map showing the correlation coefficient between bacterial abundance that differs from other groups at the genus level and butyric acid, Y-maze, hippocampal BDNF, and HDAC2 levels (Spearman analysis r = 0.35, p < 0.05). g: Heat map showing the correlation coefficient between bacterial abundance that differs from other groups at the genus level and butyric acid, Y-maze, hippocampal BDNF, and HDAC2 levels. *p < 0.05; **p < 0.01; ***p < 0.001.
