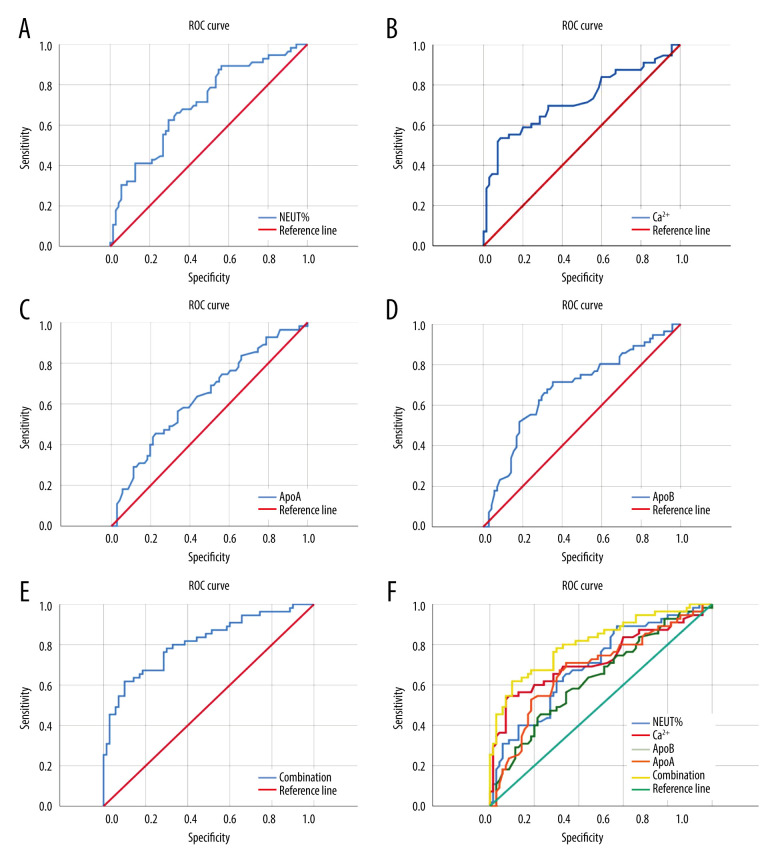
Figure 1.
(A) ROC curve of NEUT% for severity prediction of HTGP; (B) ROC curve of Ca2+ for severity prediction of HTGP; (C) ROC curve of ApoA for severity prediction of HTGP; (D) ROC curve of ApoB for severity prediction of HTGP; (E) ROC Curve for combined prediction of HTGP severity by NEUT%, Ca2+, ApoA, and ApoB; (F) ROC curve for predicting HTGP severity using NEUT%, Ca2+, ApoA, ApoB, and a combination of the 4.

