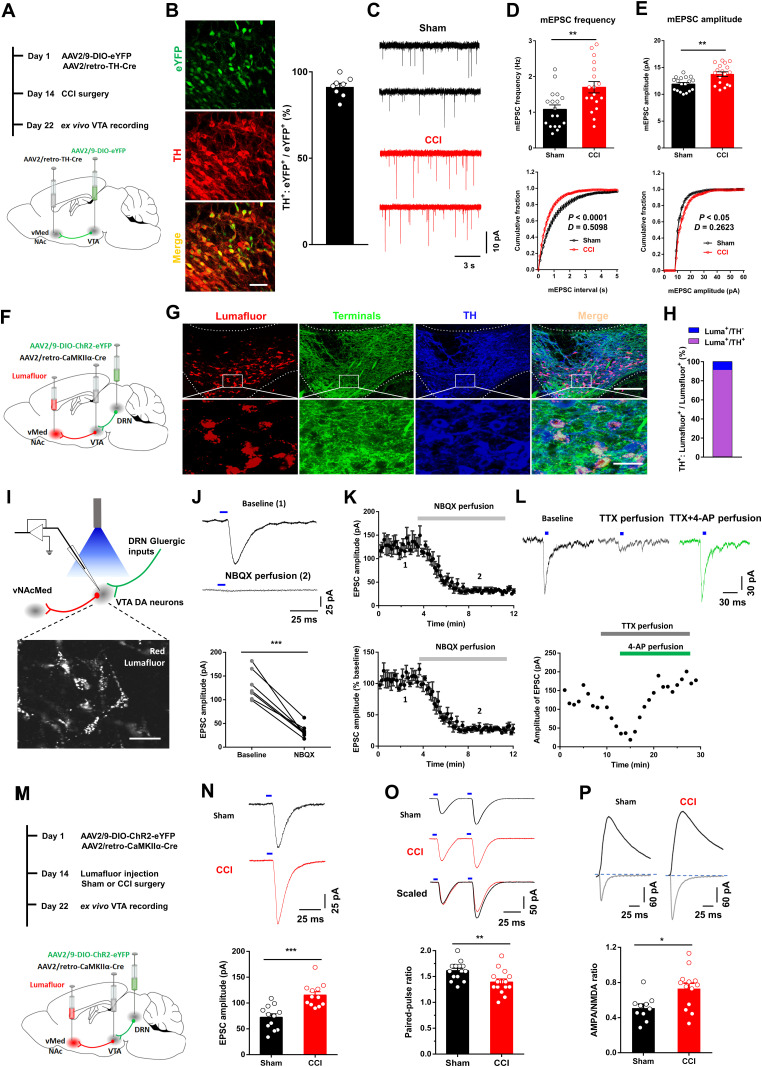
Figure 10.
Neuropathic pain induces potentiation of glutamatergic synaptic transmission onto VTADA-vNAcMed neurons. A, Experimental timeline and schematic for investigating the mEPSC in VTADA-vNAcMed neurons from sham versus CCI mice. B, Confocal image and quantification showed co-expression of eYFP in TH-positive DA cells (n = 2 sections from n = 4 mice). Scale, 25 μm. C, mEPSC traces from VTADA-vNAcMed neurons in acute VTA slices of sham (black) and CCI (red) group mice. D, Average values (top panel) and cumulative distributions (bottom panel) of mEPSC frequency in VTADA-vNAcMed neurons from sham and CCI mice (two-tailed t test, t34 = 3.09, **p = 0.004; Two-sample Kolmogorov–Smirnov test, ***p < 0.001; n = 18 for each group). E, Average values (top panel) and cumulative distributions (bottom panel) of mEPSC amplitude of VTADA-vNAcMed neurons from sham and CCI mice (two-tailed t test, t34 = 3.487, **p = 0.0014; Two-sample Kolmogorov–Smirnov test, *p = 0.0301; n = 18 for each group). F, Schematic showing intracranial injection of viruses and retrobeads. G, Representative images (top panel) showed that the majority of retrobeads-labeled VTA neurons were TH+, and these neurons were surrounded by the eYFP-positive dense terminals from the DRN. Scale, 100 μm. Enlarged box (bottom panel) showing single and double staining. Scale, 25 μm. H, Quantification showed 91.1% of retrobeads-expressing neurons were TH+ (n = 2 sections from n = 5 mice). I, Schematic diagram (top panel) showing the method of optogenetic stimulation and recording from Lumafluor+ VTADA-vNAcMed neurons ex vivo. The representative image (bottom panel) showing Lumafluor+ VTA neurons in a brain slice during patch-clamp recording. Scale, 25 μm. J, Representative traces of EPSC in Lumafluor+ VTA neurons evoked by optical stimulation of DRN terminals. Bath application of NBQX (5 μM) drastically decreased the optical EPSC amplitude (bottom panel) (paired t test, t6 = 8.639, ***p < 0.001, n = 7 neurons). K, Amplitude (top panel) and normalized amplitude (bottom panel) of optical EPSC of Lumafluor+ VTA neurons obtained prior to and during NBQX (5 μM) application (gray). L, Representative traces (top panel) and summarized time course (bottom panel) showed that the optical EPSC was eliminated by bath application of TTX (0.5 μM), and restored by 4-AP (100 μM). M, Experimental timeline and schematic showing virus injection, surgeries, and electrophysiological recording. N, Representative light-evoked EPSC traces (top panel) of VTADA-vNAcMed neurons from the sham group and CCI groups of mice. The amplitude of light-evoked EPSC was increased in CCI mice when compared with sham controls (two-tailed t test, t22 = 4.589, ***p < 0.001; n = 12 for each group). O, Representative EPSC pairs (top panel) and group data (bottom panel) of VTADA-vNAcMed neurons evoked by two optogenetic stimuli (50 ms apart) in sham and CCI mice (two-tailed t test, t28 = 2.952, **p = 0.0063; n = 15 neurons for each group). P, Examples of AMPAR- and NMDAR-mediated light-evoked EPSCs in VTADA-vNAcMed neurons form CCI mice and sham controls. Summary showing increased AMPA/NMDA ratios at DRN-VTA synapses (two-tailed t test, t21 = 2.709, *p = 0.0132; n = 10, 13 neurons). Data are represented as mean ± SEM.

