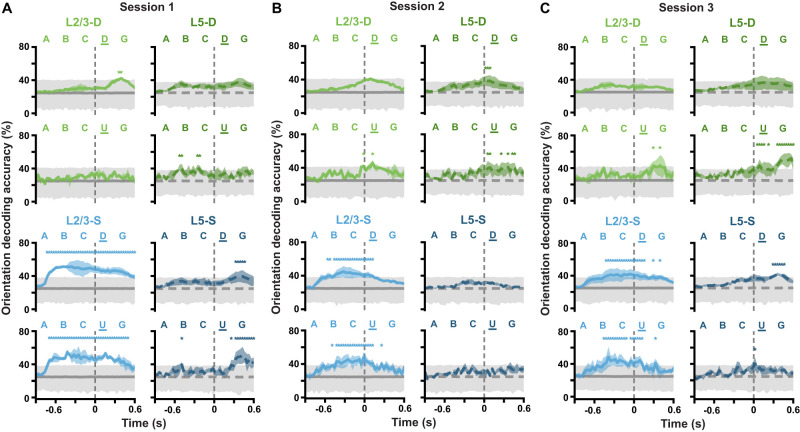
Figure 11.
(Extended analysis supporting Fig. 10.) Stimulus properties are decodable at different Gabor sequence timepoints for different imaging planes. A, Balanced accuracy (mean ± SEM over mice) for classifiers decoding mean Gabor patch orientations from ROI activity at each timepoint of A-B-C-D-G sequences (top) and A-B-C-U-G sequences (bottom) during session 1. Gray lines and shading show median (dark) and adjusted one-tailed 95% CIs (light), computed by shuffling orientation labels. B, Same as A but for session 2. C, Same as A but for session 3. In L2/3-S, stimulus orientations are decodable across much of the Gabor sequence timecourse, whereas in L5-S, they are only decodable in sessions 1 and 3, toward the end of the Gabor sequence timecourse. Similarly to L5-S, in the distal apical dendrites, stimulus orientations are generally decodable toward the end of the Gabor sequence timecourse. In particular, orientations can be decoded from more timepoints near the end of pattern-violating sequences (U-G) than the end of pattern-matching sequences (D-G). *p < 0.05 (one-tailed (upper), corrected). Statistical significance was evaluated for each timepoint. See Table 1 for details of statistical tests and the number of statistically significant timepoints in each panel.

