Figure 3.
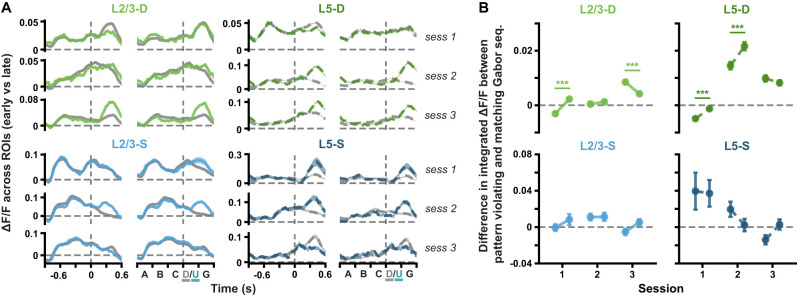
(Extended analysis supporting Fig. 2.) ΔF/F responses to pattern-violating stimuli evolve within sessions in the distal apical dendrites. A, Mean (± SEM) across ROI mean ΔF/F responses to pattern-matching (gray, A-B-C-D-G) and pattern-violating (green or blue, A-B-C-U-G) Gabor sequences in the first third (early part, left) and last third (late part, right) of each session. Dashed vertical lines mark onset of D/U images. B, Mean (± SEM) differences across ROIs in the mean integrated responses to pattern-matching vs pattern-violating Gabor sequences, as defined in A, for the first and last third of each session (early and late parts, respectively). Dashed horizontal lines mark a difference of 0. Statistical significance was evaluated within each session, by comparing the differences computed for the early part vs the late part of a session. The difference in response to D vs U images changes within sessions in the distal apical dendrites, specifically within sessions 1 and 3 for L2/3, and within sessions 1 and 2 for L5. *p < 0.05, **p < 0.01, ***p < 0.001 (two-tailed, corrected). See Table 1 for details of statistical tests and precise p-values for all comparisons.

