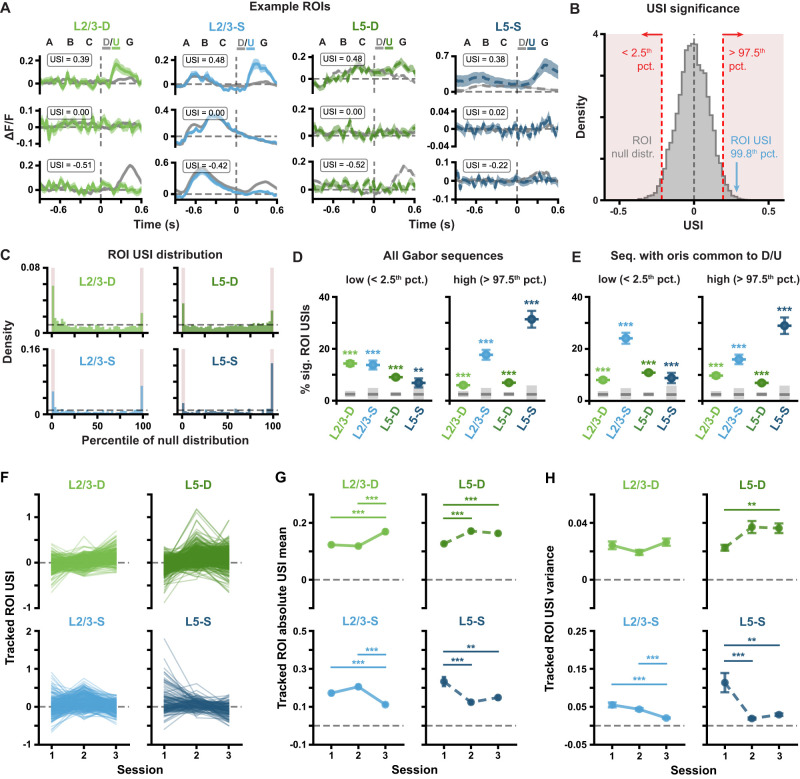
Figure 4.
Pattern-violating Gabor sequences result in different ΔF/F and USI changes in different imaging planes. A, Example session 1 ΔF/F response traces for individual compartment (left to right: L2/3-D, L2/3-S, L5-D and L5-S) ROIs with high (top), null (middle) or low (bottom) USIs. Mean ± standard error of the mean (SEM) ΔF/F across Gabor sequences is plotted. Dashed vertical lines mark onset of D/U images. B, Example USI null distribution for one ROI from L2/3-S in session 1, generated by shuffling D-G and U-G labels for the same ROI and recomputing the shuffled USIs 104 times. Significant regions highlighted in red, and true USI value labeled in blue. C, USI percentile distributions for each plane for all session 1 ROIs. Dashed horizontal lines depict null hypotheses (i.e., uniform distribution). Significant regions highlighted in red (p < 0.05, shuffle test as shown in B). D, Percentage ± bootstrapped standard deviation (SD) of significant USIs for all segmented ROIs in session 1 for each plane. All sequences (any mean orientation) are included in the analysis. E, Same as D, but restricted to Gabor sequences with mean orientations shared between D and U images  . F, Gabor sequence stimulus USIs for all tracked ROIs. Each line represents a single ROI’s USIs over all three sessions. G, Mean (± SEM) across the absolute values of the Gabor sequence stimulus USIs for tracked ROIs, as shown in F. H, Variance (± bootstrapped SD) across the Gabor sequence stimulus USIs for tracked ROIs, as shown in F. *p < 0.05, **p < 0.01, ***p < 0.001 (two-tailed, corrected). See Table 1 for details of statistical tests and precise p-values for all comparisons.

