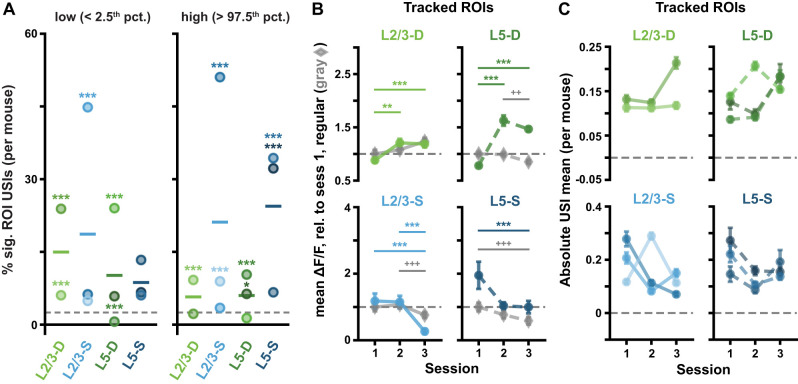
Figure 5.
(Extended analysis supporting Fig. 4.) ROI responses to pattern-violating Gabor sequences are consistent in tracked ROIs and across mice. A, Percentage of significant USIs in session 1 for each plane, where each dot corresponds to a separate mouse. Statistical significance for each datapoint was evaluated against its own adjusted binomial CI (not shown). Lines show the pooled percentage across mice for each plane (slightly different from the pooled percentage across ROIs plotted in Fig. 4D). Dashed horizontal lines mark the theoretical chance level (2.5%). Results are consistent with those pooled across mice, with 10 out of the 11 animals showing a higher percentage of significant ROI USIs than expected by chance in at least one tail (Fig. 4D). B, Mean (± SEM) across tracked ROIs of the mean ΔF/F responses across sequences for regular sequence pattern-matching images (gray diamonds: A-B-C) and pattern-violating images (green or blue circles, U-G), as in Fig. 2C. Responses are calculated relative to session 1 regular sequence responses, marked by dashed horizontal lines. Results are consistent with the full ROI population results (Fig. 2C). C, Mean (± SEM) across the absolute values of the Gabor sequence stimulus USIs for tracked ROIs, as in Figure 4G, but split by mouse. Results are consistent with those pooled across mice (Fig. 4G). *p < 0.05, **p< 0.01, ***p < 0.001 (two-tailed, corrected). +p < 0.05, ++p < 0.01, +++p < 0.001 (two-tailed, corrected), for regular stimulus comparisons (gray) in B. See Table 1 for details of statistical tests and precise p-values for all comparisons.

