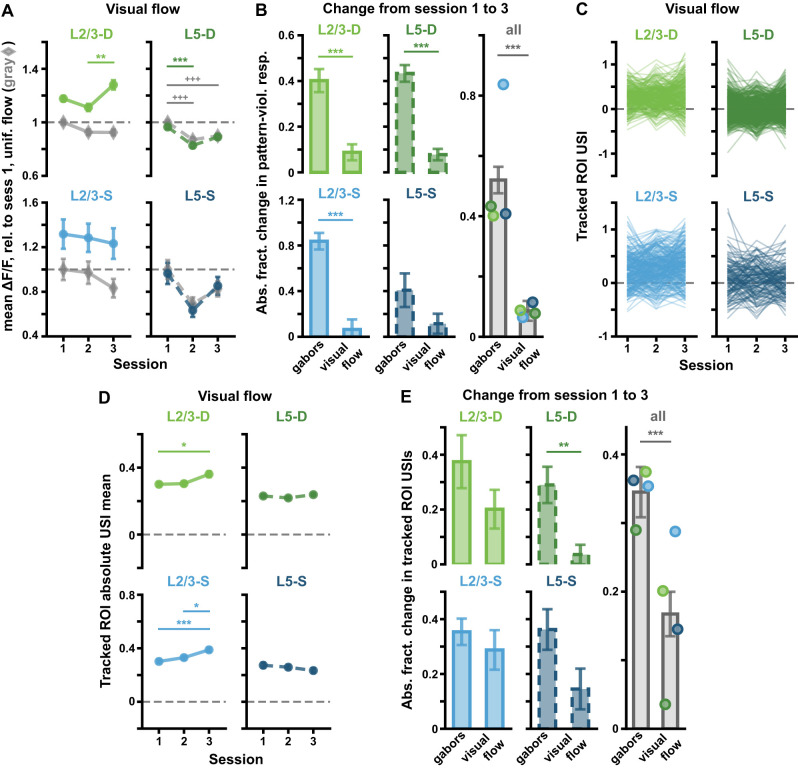
Figure 7.
(Extended analysis supporting Fig. 6.) Visual counter-flow sequences do not result in the same ΔF/F changes across sessions as do pattern-violating Gabor sequences. A, Mean (± SEM) across ROIs of the mean ΔF/F responses across sequences for uniform flow (gray diamonds) and counter-flow (green or blue circles), as defined in Fig. 6B. Responses are calculated relative to session 1 uniform flow responses, marked by dashed horizontal lines. Corresponds to Fig. 2C for Gabor sequences. B, Absolute fractional change (± bootstrapped SD) in mean responses to pattern-violating stimuli from session 1 to 3 for Gabor sequences vs the counter-flow stimulus for each plane (left and middle columns), and pooled across all planes (right column) (see Eq. 2). In all imaging planes except L5-S, changes in ROI responses to the pattern-violating Gabor stimulus from session 1 to 3 were significantly greater than for the visual counter-flow stimulus. C, Visual flow stimulus USIs for all tracked ROIs. Each line represents a single ROI’s USIs over all three sessions. Corresponds to Fig. 4F for Gabor sequences. D, Mean (± SEM) across the absolute values of the visual flow stimulus USIs for tracked ROIs, as shown in C. Corresponds to Fig. 4G for Gabor sequences. E, Similar to B, but here mean (± bootstrapped SD) absolute fractional changes in USIs from session 1 to 3 across tracked ROIs are plotted (see Eq. 2). In L5-D and all compartments combined, changes in USIs for tracked ROIs from session 1 to 3 were significantly greater for the Gabor stimulus than for the visual flow stimulus. *p < 0.05, **p < 0.01, ***p < 0.001 (two-tailed, corrected). +p < 0.05, ++p < 0.01, +++p < 0.001 (two-tailed, corrected), for uniform pattern stimulus comparisons (gray) in A. See Table 1 for details of statistical tests and precise p-values for all comparisons.

