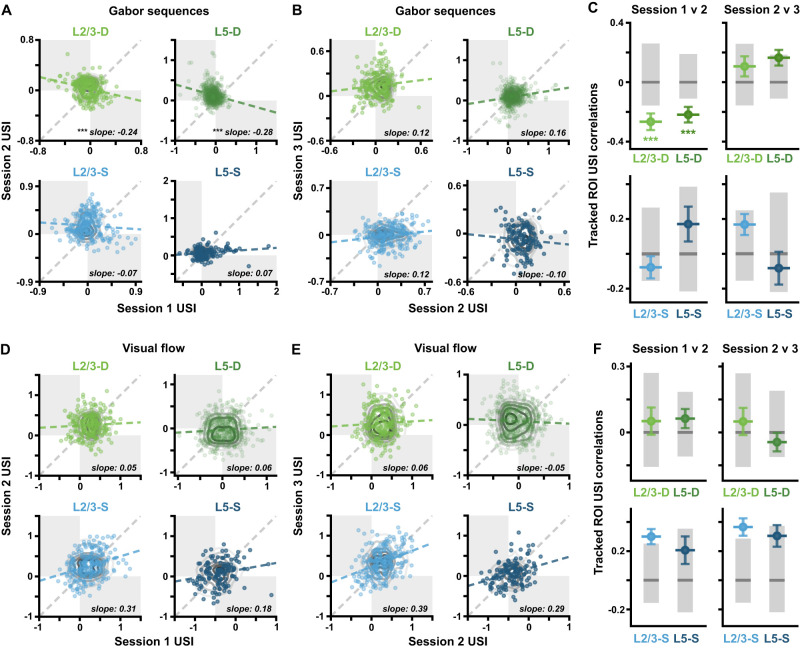
Figure 9.
Pattern-violating Gabor sequences result in predictable ΔF/F changes in distal apical dendritic ROIs. A, Gabor USI scatterplots showing correlations between sessions 1 and 2. Each point reflects a single-tracked ROI’s USIs on two sessions. Gray contour lines show null distributions, computed by shuffling ROI labels. The estimated regression slopes for each plane (blue or green, dashed) are plotted against the identity line (gray, dashed). Opposite quadrants are shaded in gray. B, Same as in A, but for Gabor sequence USIs in sessions 2 and 3. C, USI correlations (± bootstrapped SD) from A and B. Gray bars show median (dark) and adjusted 95% CIs (light), computed by shuffling ROI labels. D, Same as in A, but for visual flow USIs in sessions 1 and 2. E, Same as in A, but for visual flow USIs in sessions 2 and 3. F, Same as in C, but for visual flow USI correlations. *p < 0.05, **p < 0.01, ***p < 0.001 (one-tailed (lower), corrected). See Table 1 for details of statistical tests and precise p-values for all comparisons.

