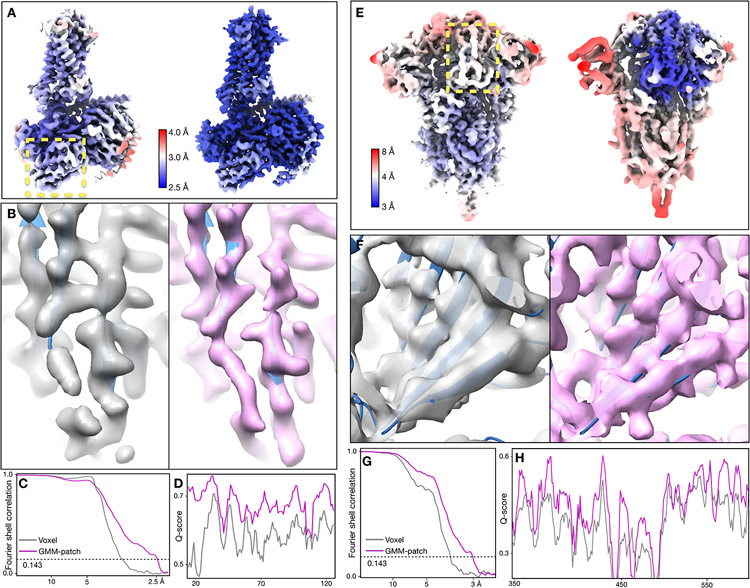
Fig. 1.
Refinement of GPCR (EMPIAR-10786) and SARS-COV2 spike (EMPIAR-10492) datasets. (A) Reconstructions of the GPCR using original angle assignment (left) and after the patch-by-patch alignment (right), colored by local resolution. The yellow box highlights the region shown below. (B-D) Comparison of real space features, “gold-standard” FSC and Q-score between the original reconstruction (gray) and the patch-by-patch refinement (pink). (E) Reconstructions of the SARS-COV2 spike using original angle assignment (left) and after the focused refinement of RBD (right), colored by local resolution. The yellow box highlights the target domain for focused refinement. (F-H) Comparison of real space features, “gold-standard” FSC and Q-score of RBD between the original reconstruction (gray) and the patch-by-patch refinement (pink).

