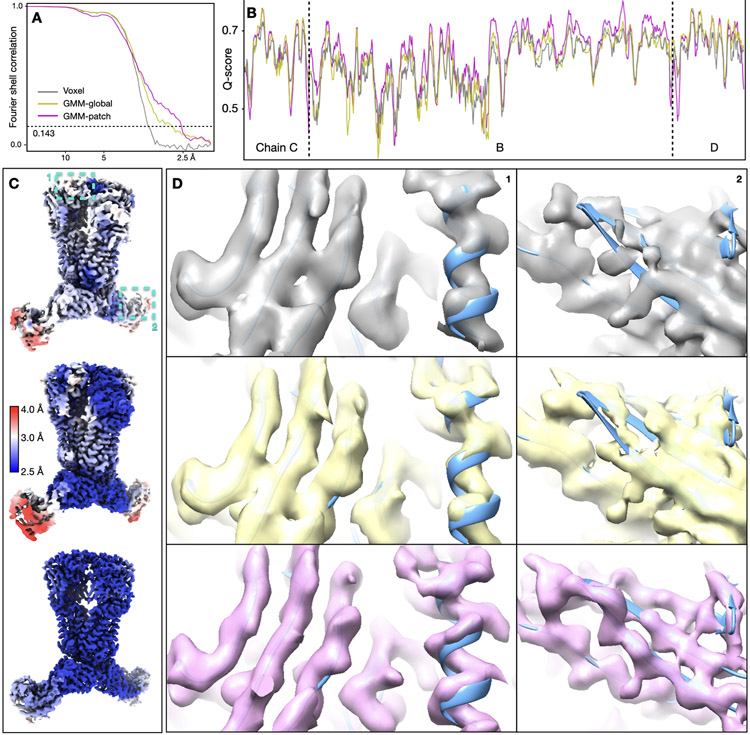
Extended Data Figure 4. Detailed results of the ABC transporter dataset (EMPIAR-10374).
(A) “Gold-standard” FSC curves of the reconstruction using initial orientation (gray), global GMM-based refinement (yellow) and patch-by-patch refinement (pink). (B) Q-score comparison of the three corresponding maps. (C-D) Overall structure of the three reconstructions, colored by local resolution, and comparison of local real space features. The cyan boxes in C highlight the location of features in the corresponding columns shown in D.

