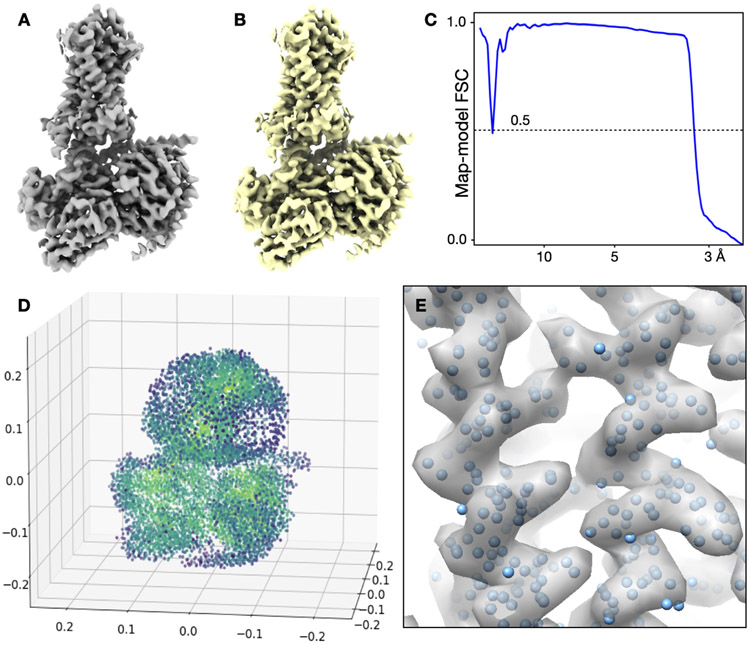
Extended Data Figure 5. Visualization of GMMs.
(A) Reconstruction of the GPCR using the voxel map representation, determined at 3.3Å resolution. 6x10⁶ floating point values are required to represent the structure. (B) GMM representation of the A, shown in isosurface view. 5x10⁴ floating point values are used to represent the structure. (C) FSC curve between A and B. The two structures are virtually identical up to 3.3Å. (D) Visualization of the GMM from B using 3D scatter plot. Each point is colored by the amplitude of the Gaussian function and the size of the points correspond to the width of Gaussian functions. (E) Overlay of the coordinates of Gaussian functions in the corresponding density map.

