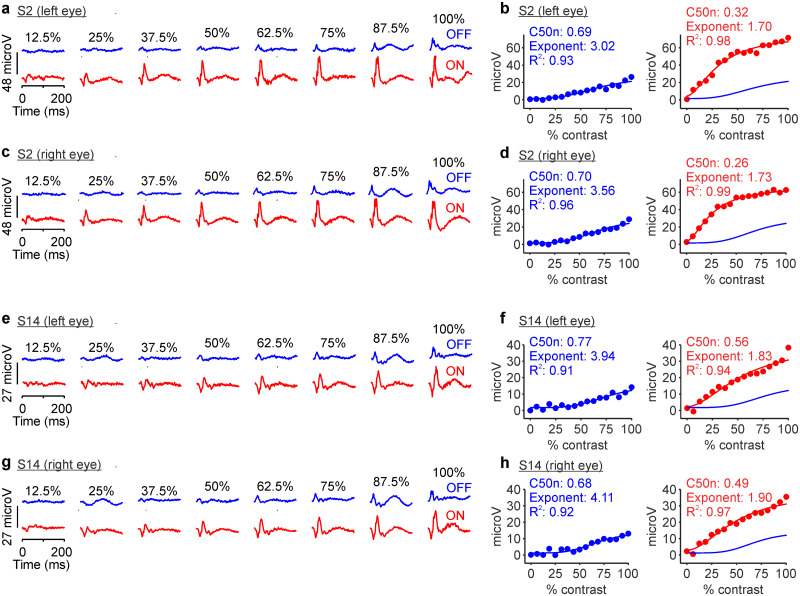
Figure 7.
Retinal ON and OFF contrast response functions measured at 800 cd/m2 luminance range in different background luminance. The format is the same as Figure 2. a, Example ERG responses from the left eye of subject S2 measured with a background luminance of 900 cd/m2 for dark stimuli and 100 cd/m2 for light stimuli. b, OFF and ON contrast responses from the left eye of subject S2 fitted with a Naka–Rushton function. c, d, Same as a,b for the right eye of subject S2. e–h, Same as a–d for subject S14.

