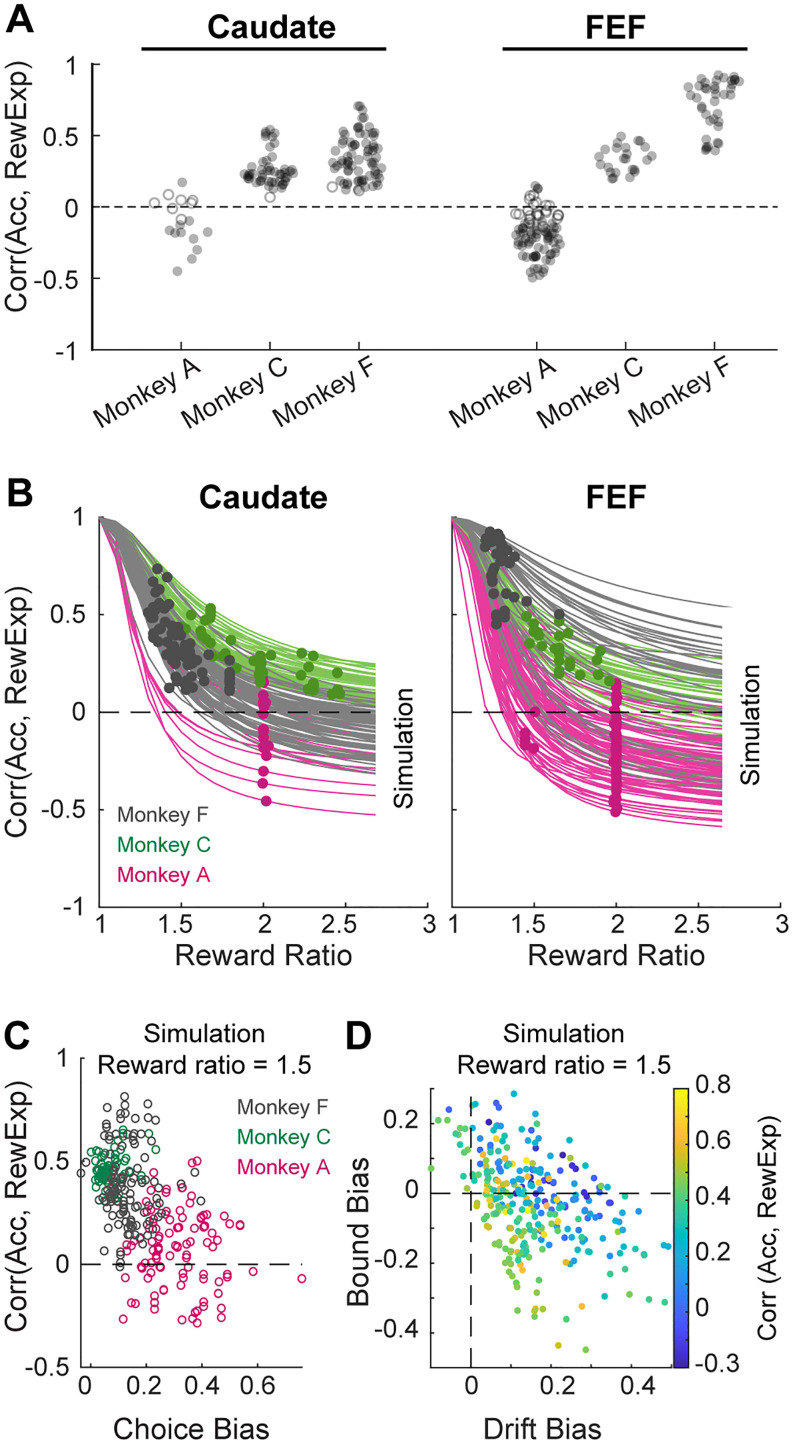
Figure 3.
Decoupling of accuracy expectation and reward expectation. A, Distributions of the Spearman correlation coefficients between accuracy expectation and reward expectation in all recording sessions. Filled circle: correlation is different from zero for the individual session (p < 0.05). Note that correlation coefficients were below 1 for all sessions. B, The correlation coefficient depended on the ratio between large and small rewards. Each line depicts the coefficients from simulated results using different reward ratios for each session. Each dot depicts the actual coefficient and reward ratio from the given session. Colors indicate the results from the three monkeys. C, The correlation coefficient (simulated for a fixed reward ratio of 1.5) covaried with the degree to which the reward asymmetry biased choices in individual sessions (points). D, The correlation coefficient (simulated for a fixed reward ratio of 1.5) covaried with estimated reward biases in drift-rate and relative bound heights in a DDM framework. Reward biases in drift rates and relative bound heights were estimated from the same DDM fits that were used to calculate accuracy expectation.

