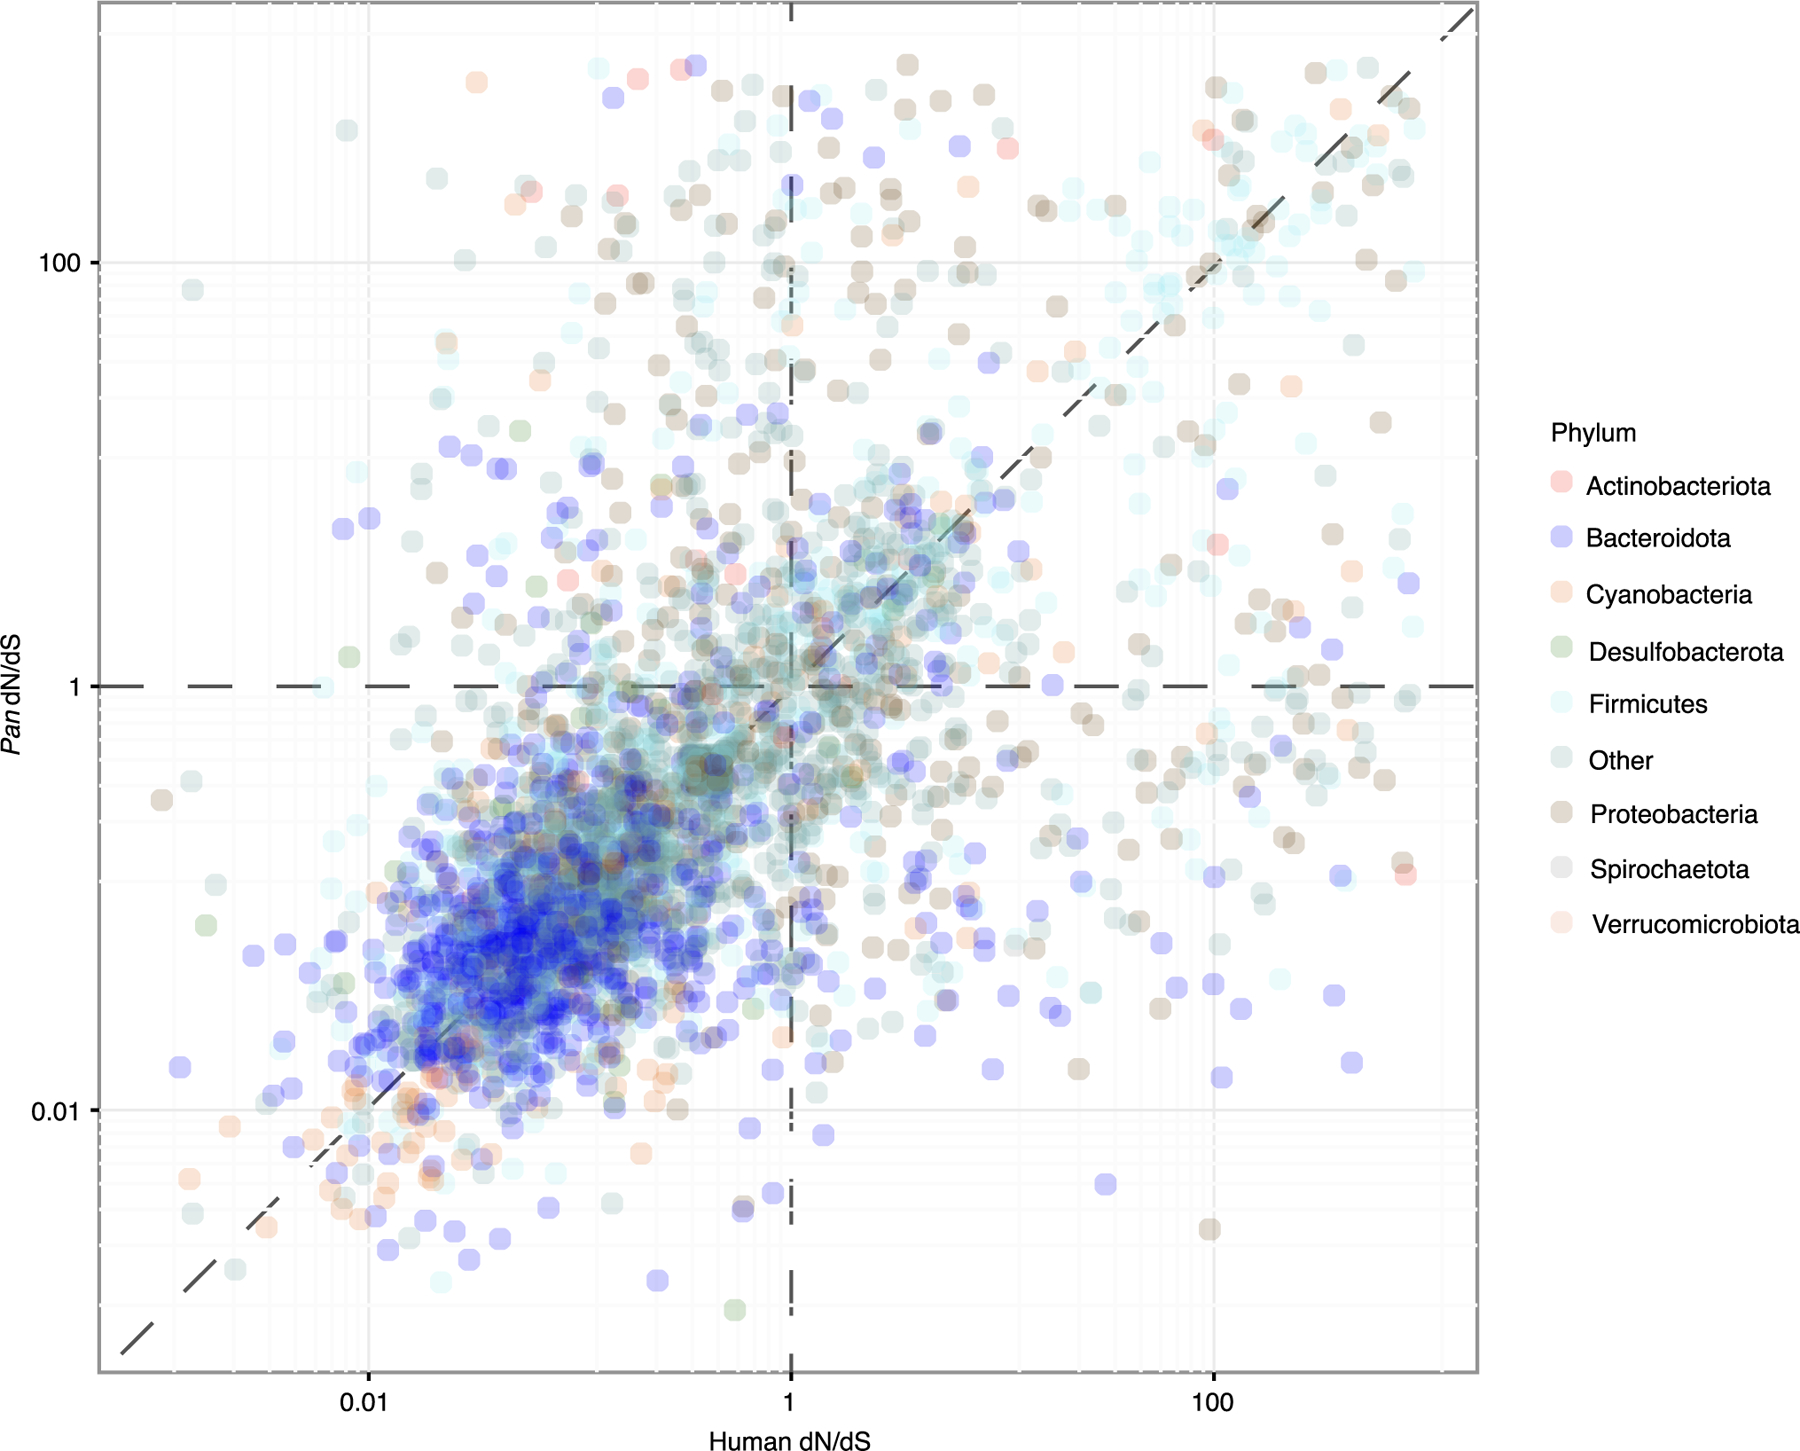
Extended Data Fig. 8 |. Genomic signatures of selection in human and chimpanzee gut bacteria.

Scatter plot shows the relationship between per-CORF dN/dS values in humans and Pan. Points correspond to individual CORFs from co-diversifying bacterial lineages detected in human and Pan. Dashed vertical and horizontal lines correspond to the dN/dS expectation under neutral evolution, and dashed diagonal line corresponds to a 1-to-1 relationship between dN/dS values in humans and Pan. Points are coloured based on bacterial phyla as in Fig. 1 and as indicated in the key..
