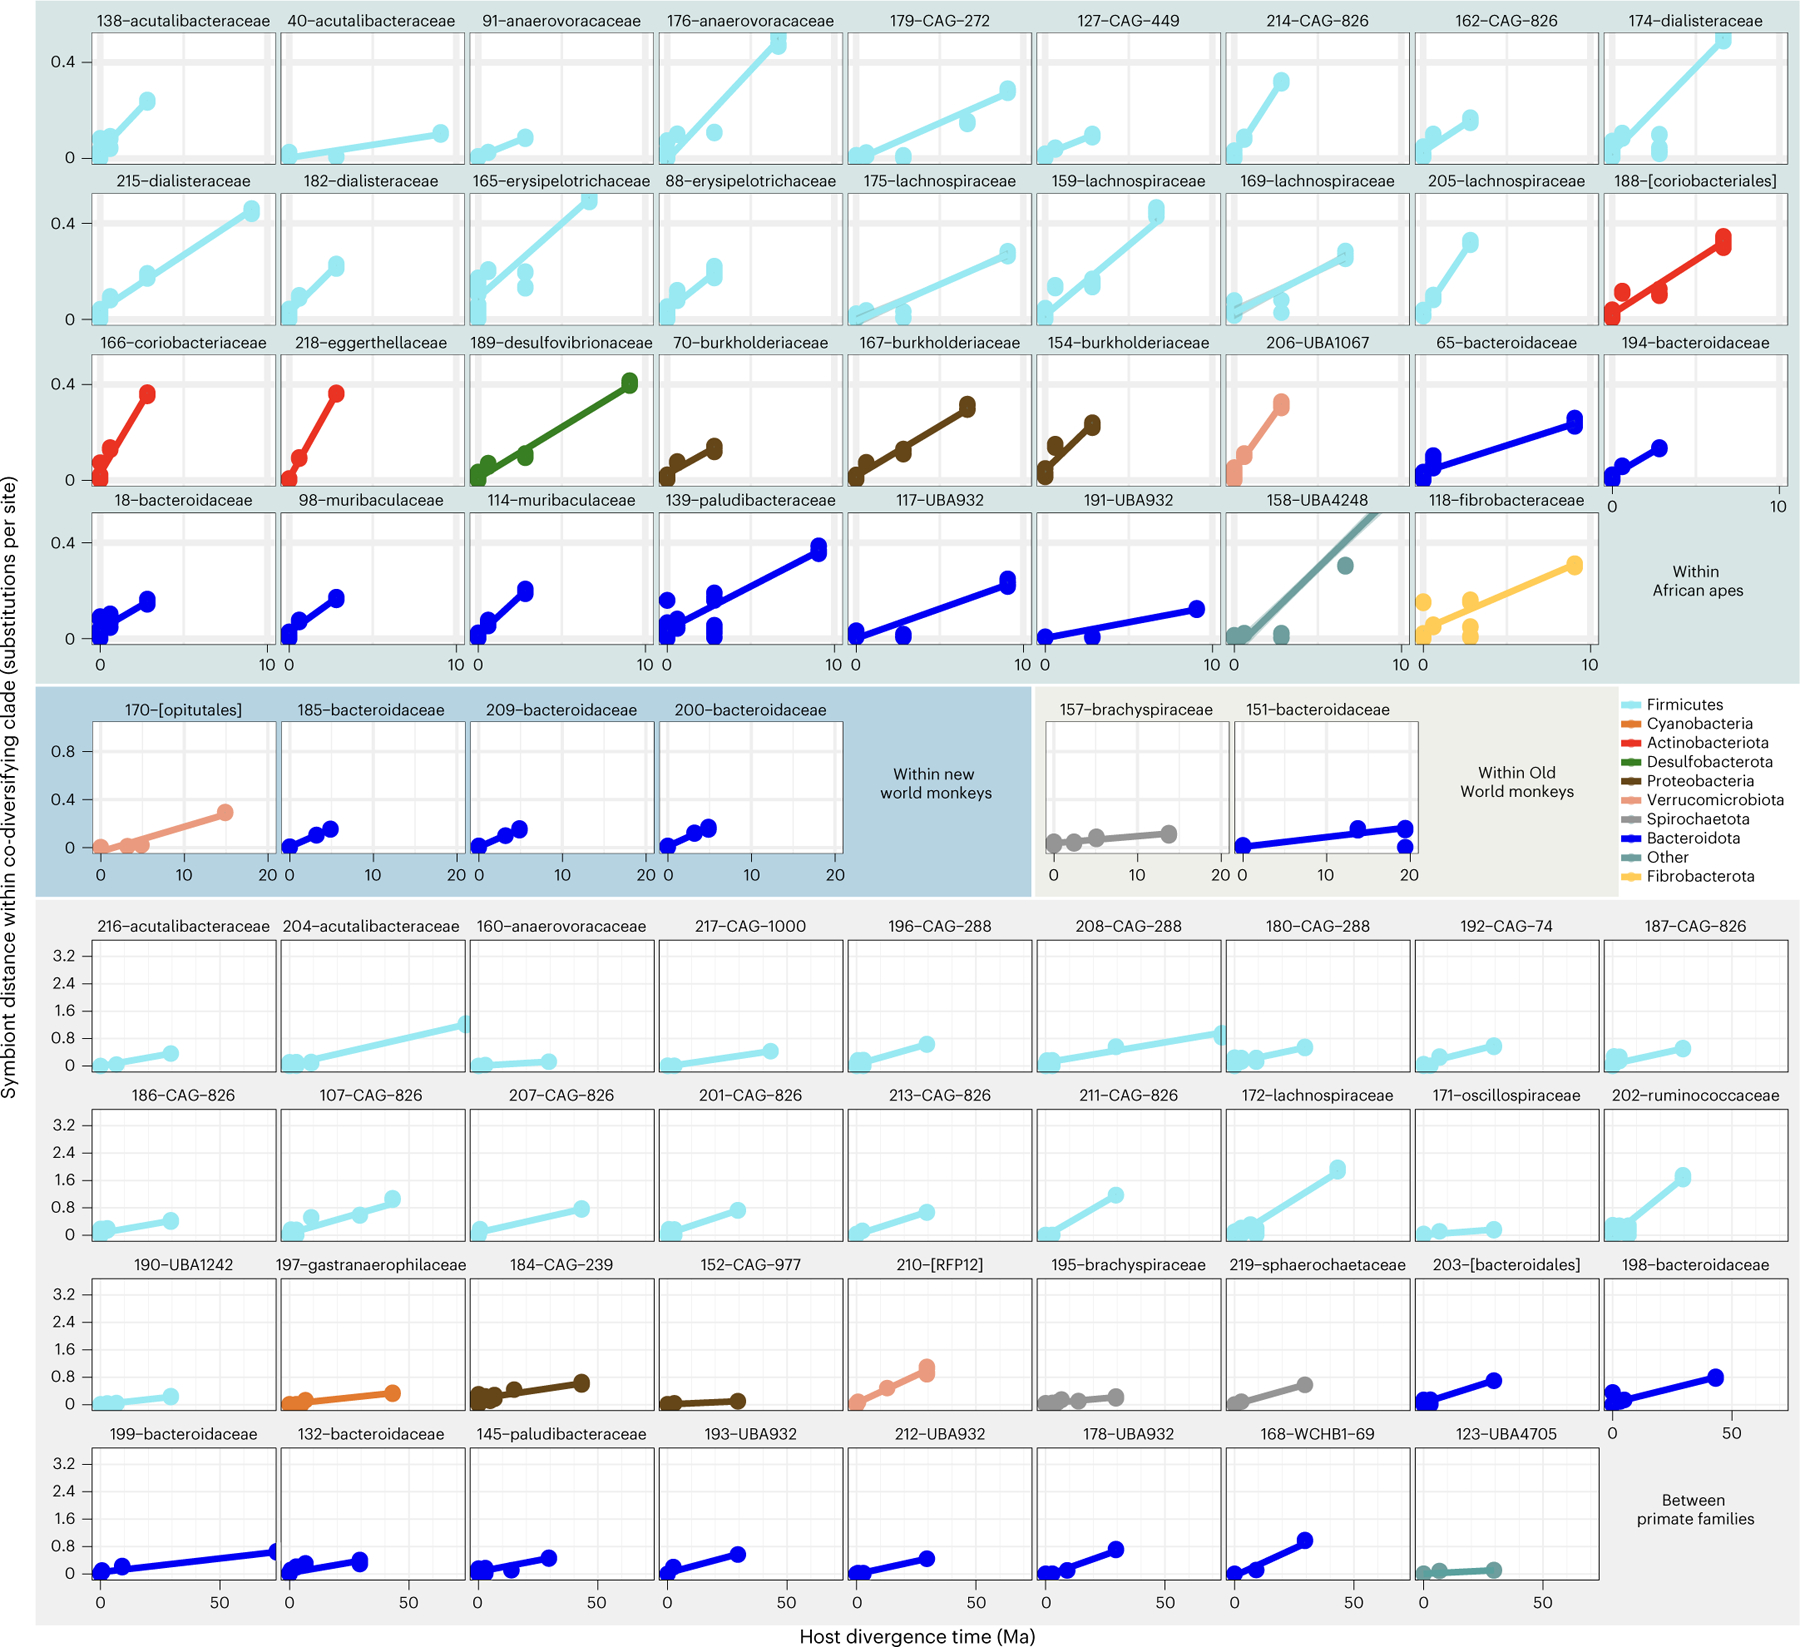
Fig. 2 |. Molecular timescales for bacterial evolution in the primate gut.

Scatterplots and regression lines show relationships between DNA sequence divergence (nucleotide substitutions per site) of core genes (bac120 marker set) within co-diversifying clades and divergence times of host species from which bacterial genomes were recovered. Each facet corresponds to a single co-diversifying clade. All co-diversifying clades displaying Mantel’s r > 0.95 are shown. Facets are grouped on the basis of the host species from which bacterial genomes were recovered as indicated by backdrop colours corresponding to Fig. 1a. Clade ID numbers and family- or order-level taxonomic assignments (Supplementary Table 4) are presented above each facet.
