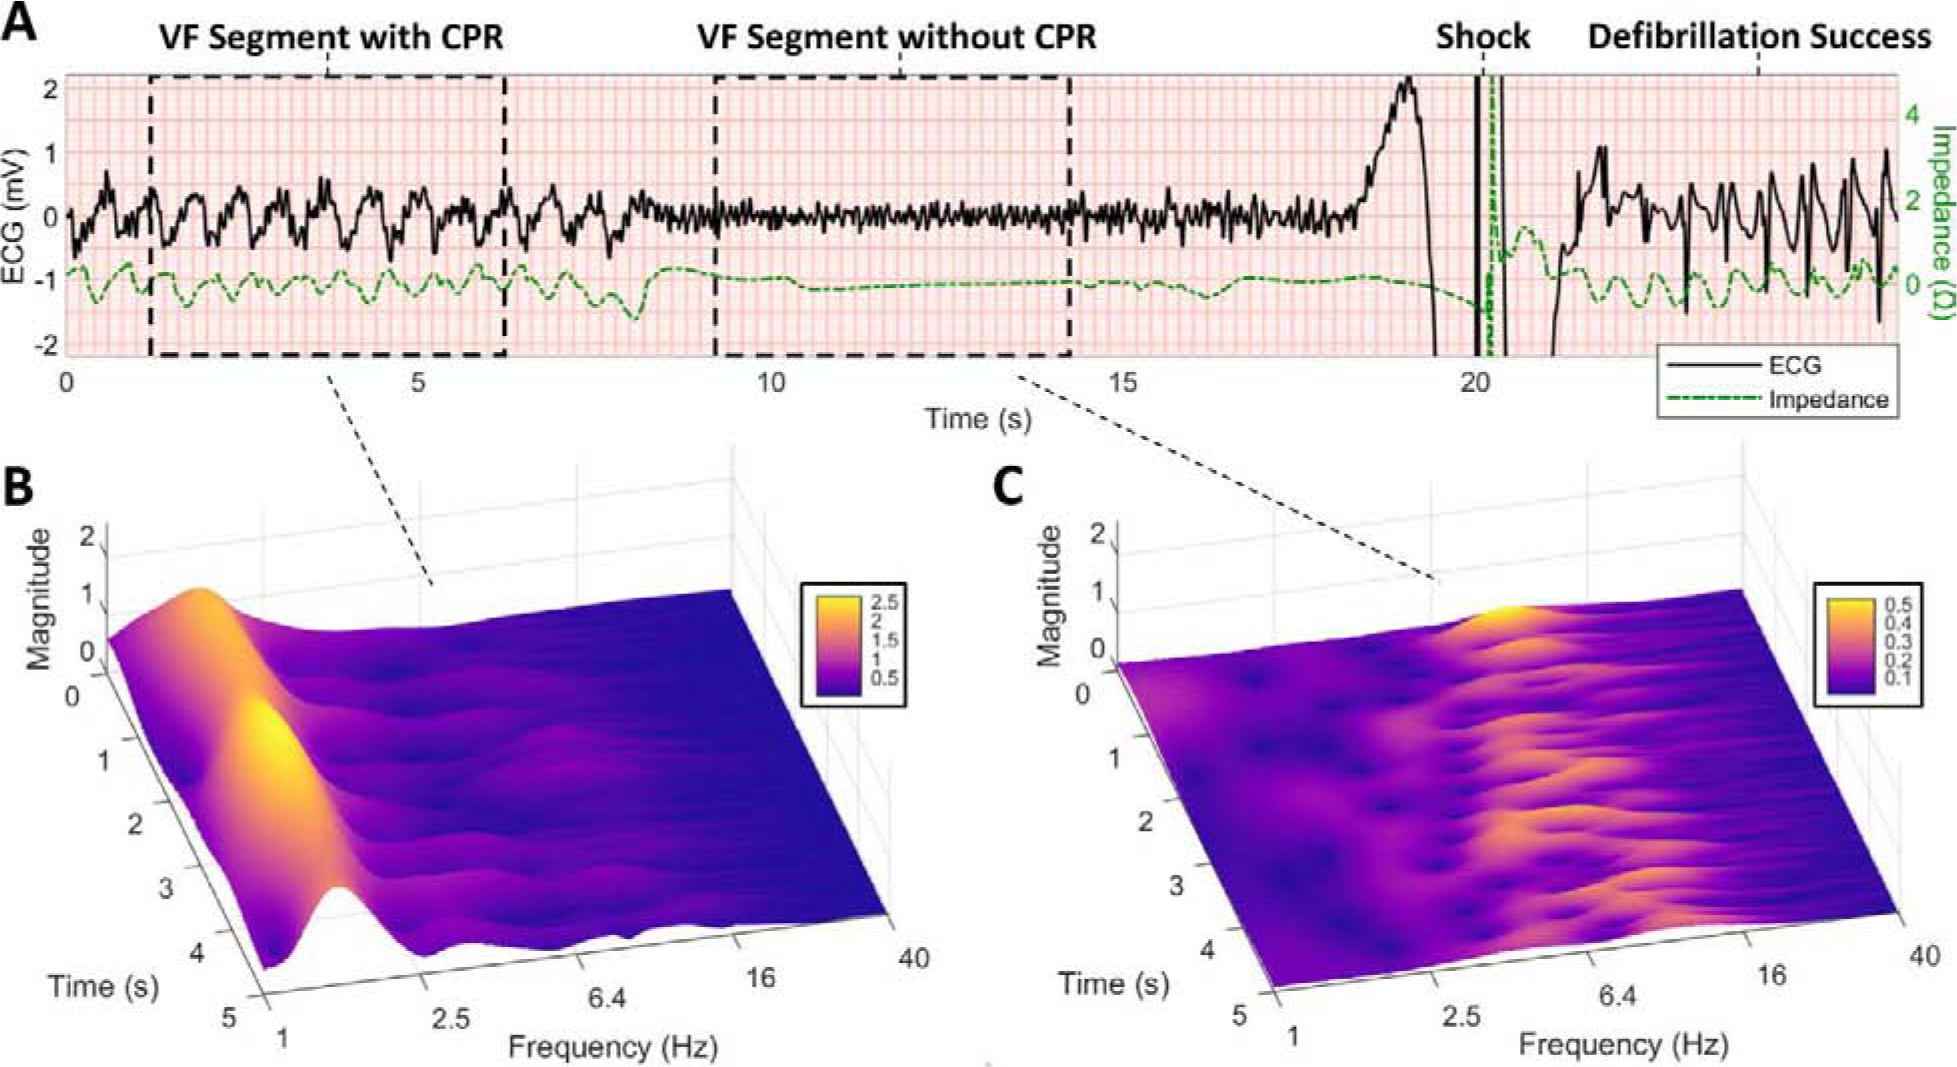
Figure 1. Examples of VF Segment Collection with and without CPR.

(A) Example of adjacent 5-s VF ECG segments collected during CPR and without CPR prior to defibrillation shock. CPR is confirmed by chest compression oscillations in the concurrent impedance channel. Defibrillation success is confirmed by termination of VF and return of organized ventricular rhythm (QRS complexes) following shock. (B) Scalogram of VF during CPR illustrates dominant CPR fundamental at approximately 1.6 Hz with transient compression artifacts extending to higher frequencies. (C) Scalogram of VF without CPR illustrates a relatively high dominant VF frequency (ranging from approximately 6–12 Hz in this example), which may suggest an energetic myocardial metabolic substrate amenable to defibrillation. (CPR = cardiopulmonary resuscitation, ECG = electrocardiogram, VF = ventricular fibrillation.)
