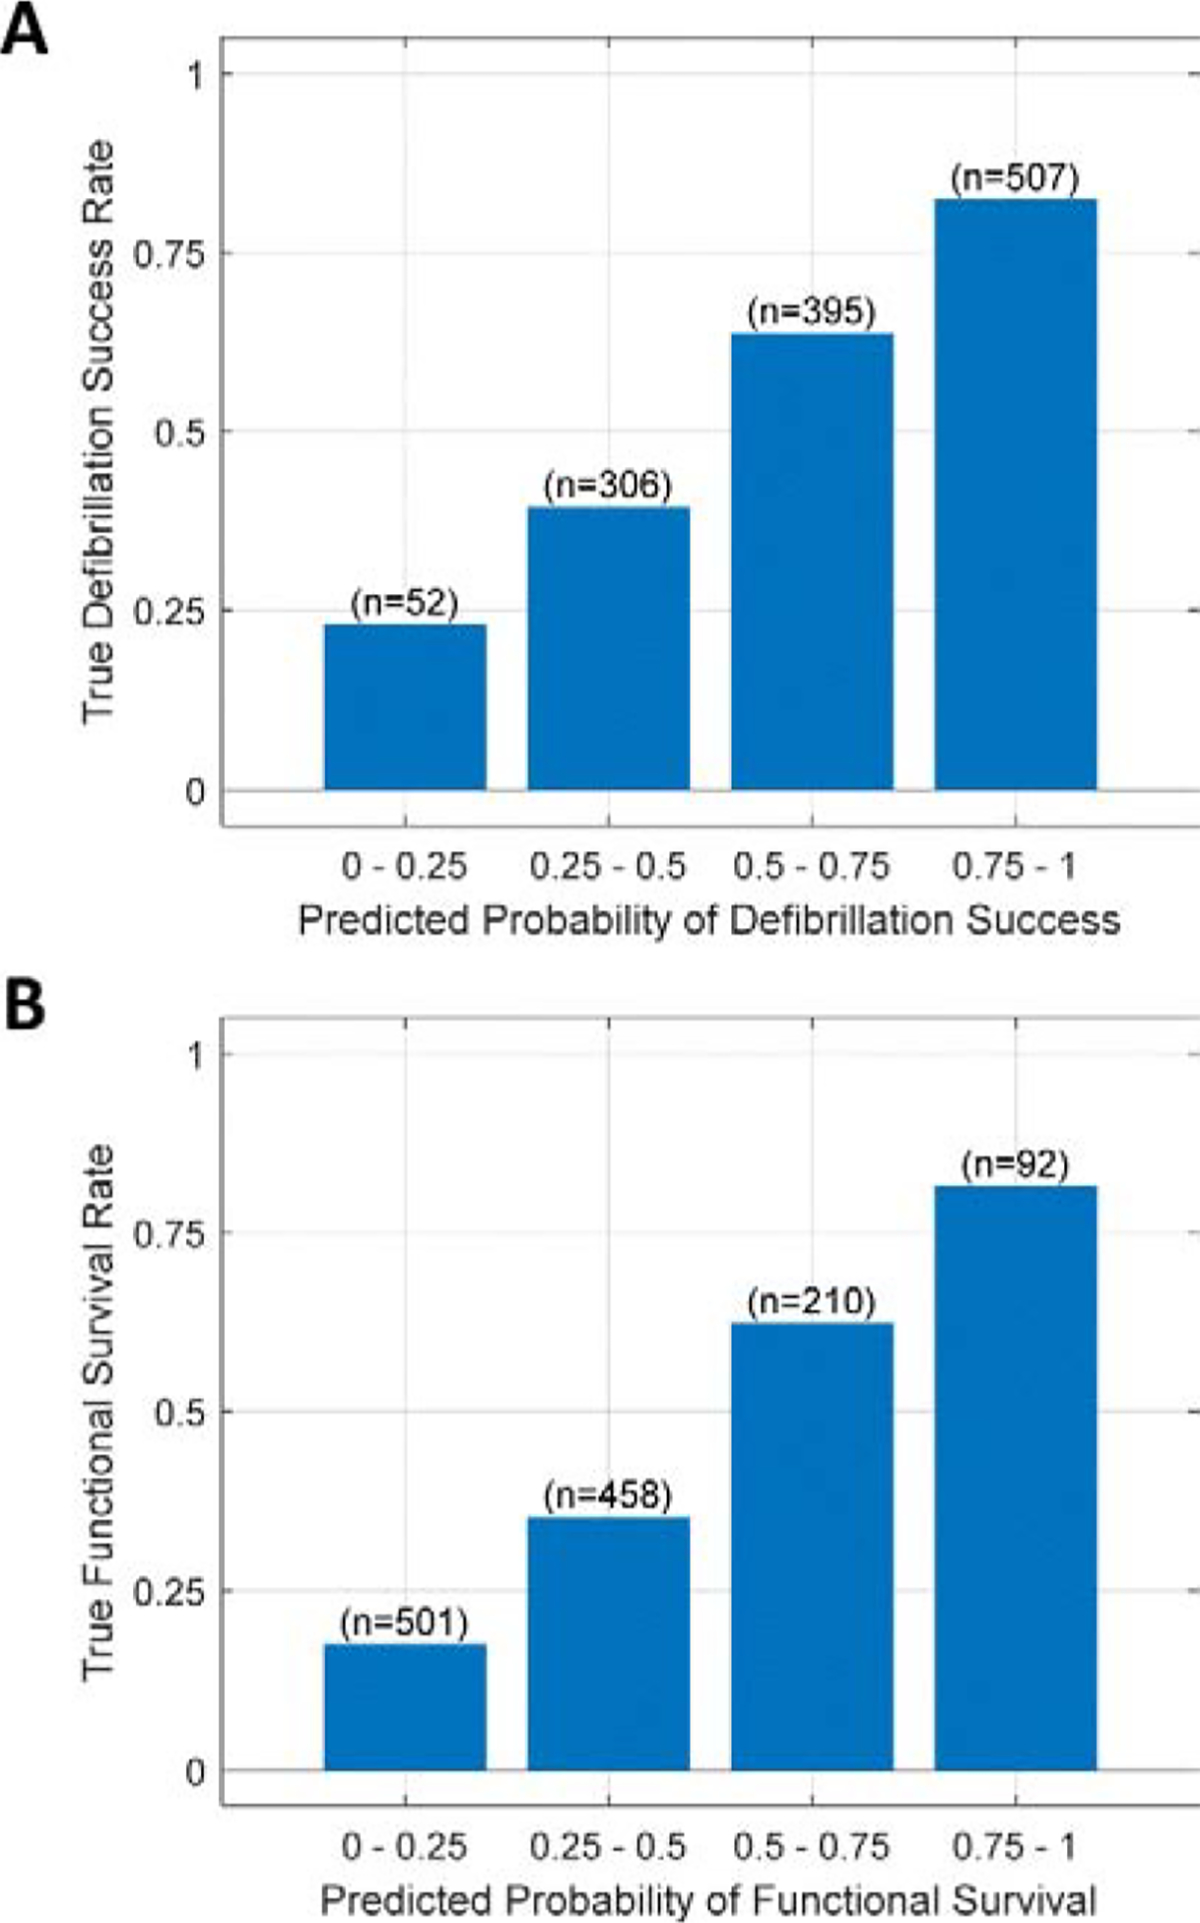
Figure 7. Predicted outcomes versus true outcomes.

True rates of positive outcome are shown within each quartile of predicted probabilities of positive outcome, using validation data during CPR. (A) The true rates of defibrillation success were within the predicted probability quartiles for defibrillation success. (B) The true rates of functional survival were within to the predicted probability quartiles for functional survival. (n = number of validation segments within each predicted probability decile)
