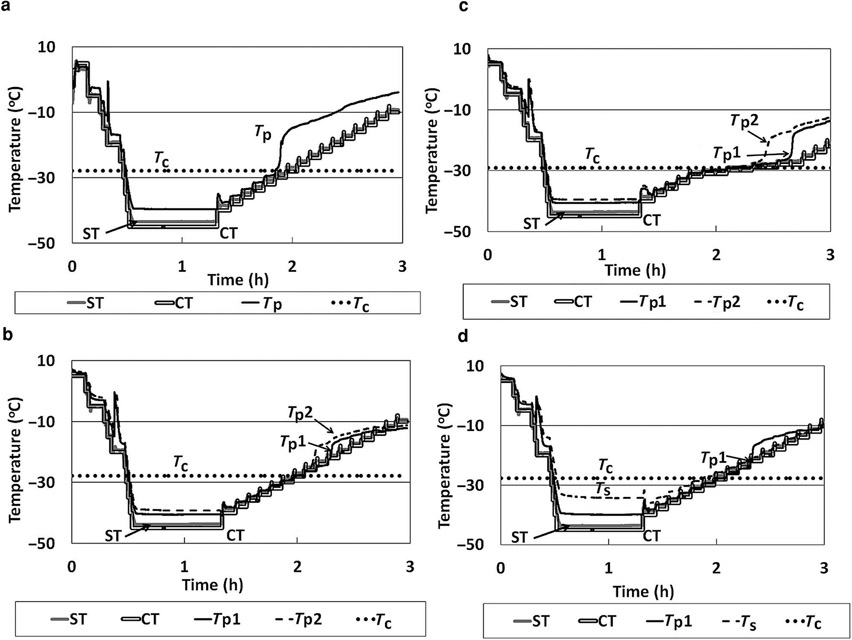
Figure 3.
(a) Temperature data for OCT–FDM of a 5% sucrose solution, 0.6 mL. (b) Temperature data for OCT–FDM of a 5% sucrose solution, 1.25 mL. (c) Temperature data for OCT–FDM of a 5% sucrose solution, 1.25 mL slow ramp rate. (d) Temperature data for OCT–FDM of a 5% sucrose solution, 1.25 mL TC on side of the vial. ST, shelf temperature; CT, commanded temperature; Tp, product temperature; Tp1, product temperature 1; Tp2, product temperature 2; and Ts, temperature side of vial.

