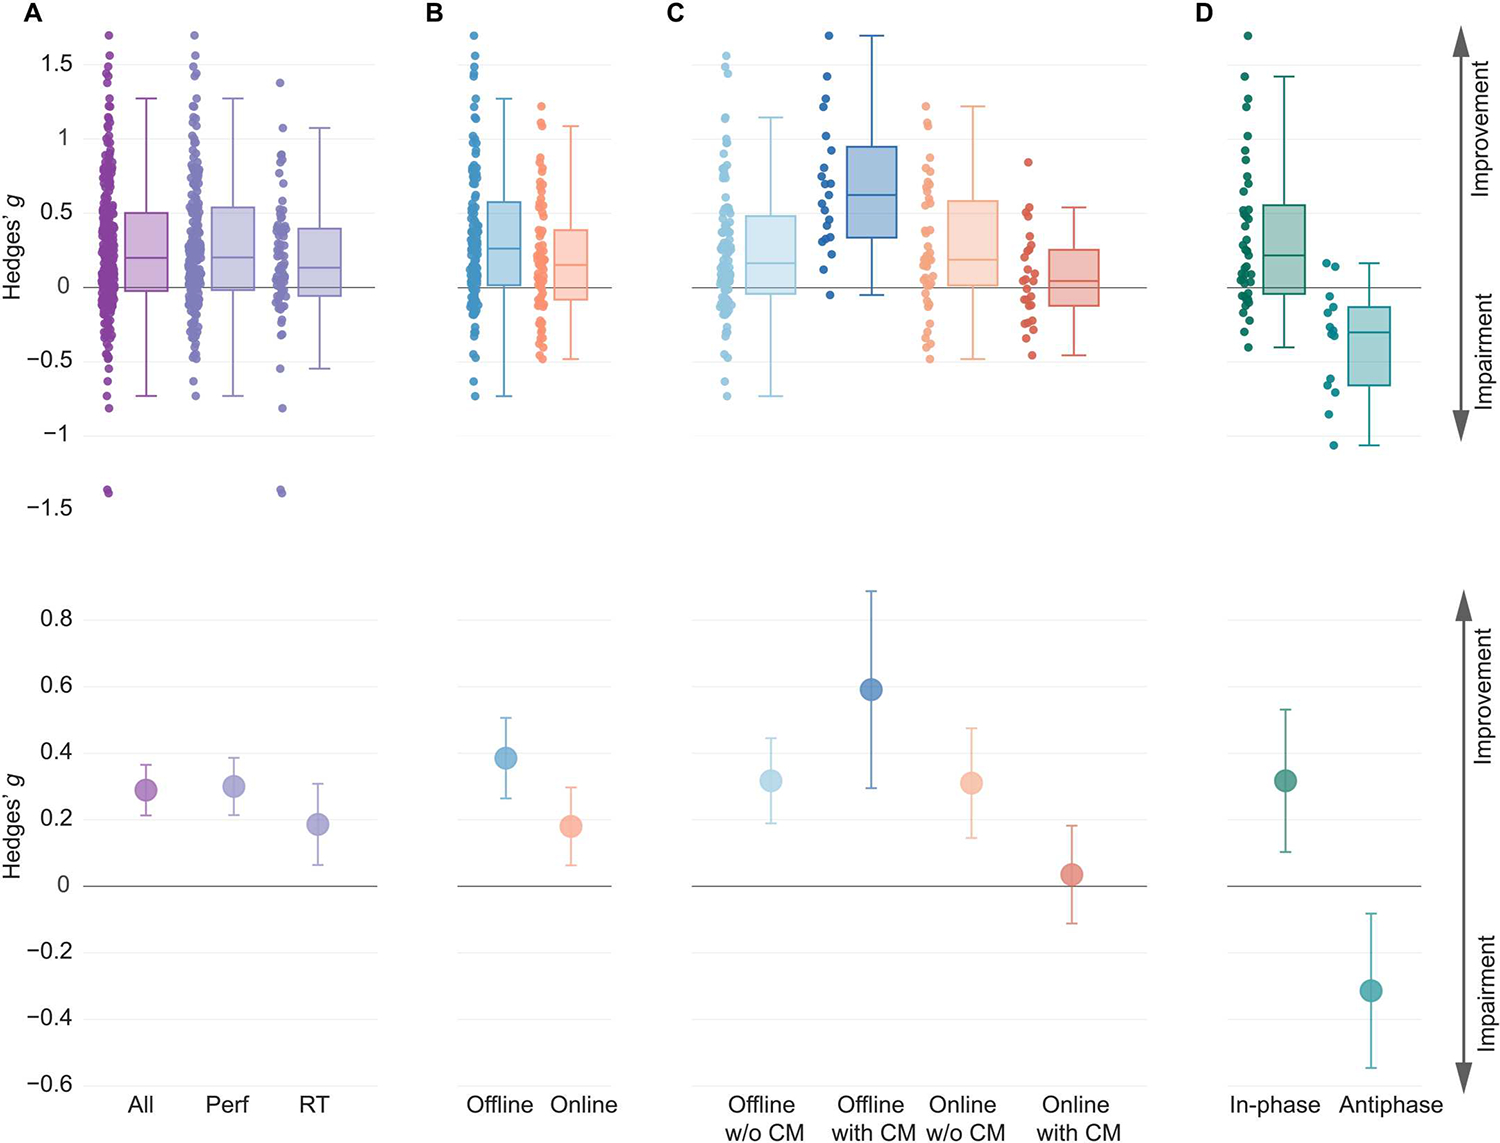
Fig. 2. Summary of meta-analysis results.

(A) Box plots and point estimates of outcome-based effects on cognitive function overall (Performance, RT, and clinical symptoms combined) and on Performance and RT-based outcomes separately are shown. (B) Box plots and point estimates for offline and online effects on outcome-based Performance measures are shown. (C) Box plots and point estimates of interaction effects according to the timing of behavioral assessment and use of current flow models (CM) that simulate the flow of electrical current and strength of the electric field in the human brain are shown. Performance, RT measures, and clinical symptoms were combined. (D) Box plots and point estimates of hypothesis-based effects of phase manipulation are shown.“In-phase” represents the improving effect of in-phase synchronization on functional outcome, and “antiphase” represents the disrupting effect of antiphase synchronization on functional outcome. All plots show data before outlier removal. In all plots, individual points represent individual effect size point estimates for each experiment. Box plot center line, median; box plot limits, upper and lower quartiles; whiskers, maximum and minimum values. Error bars around point estimates reflect 95% confidence intervals. Perf, Performance; RT, reaction time; Offline w/o CM, offline effects in experiments without the current flow model; Offline with CM, offline effects in experiments with the current flow model; Online w/o CM, online effects in experiments without the current flow model; Online with CM, online effects in experiments with the current flow model.
