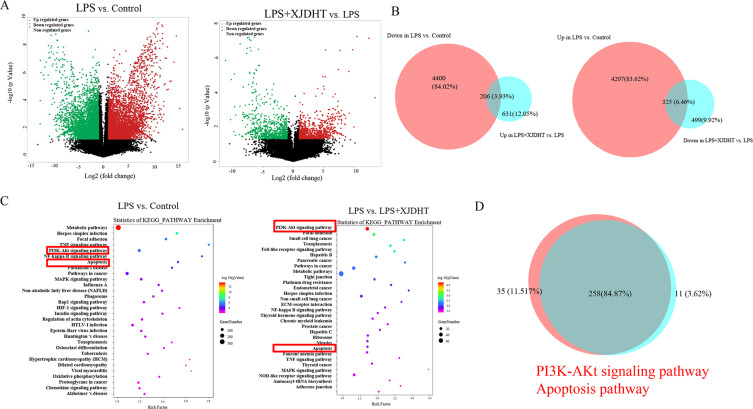
Figure 3.
Genome-wide gene expression profiling of cardiac tissues from mice with sepsis after XJDHT treatment. (A) Volcano plots comparing gene expression profiles (fold change ≥ 2, P < 0.05). (B) Overlapping areas represent genes under-expressed in the LPS group but over-expressed in the LPS + XJDHT group (n = 206) and genes over-expressed in the LPS group but under-expressed in the LPS + XJDHT group (n = 324). (C) KEGG pathway enrichment analysis of differentially expressed transcripts for LPS+NS vs control and LPS+XJDHT vs LPS+NS. (D) Overlapping KEGG pathways for LPS+NS vs control and LPS+XJDHT vs LPS+NS.

