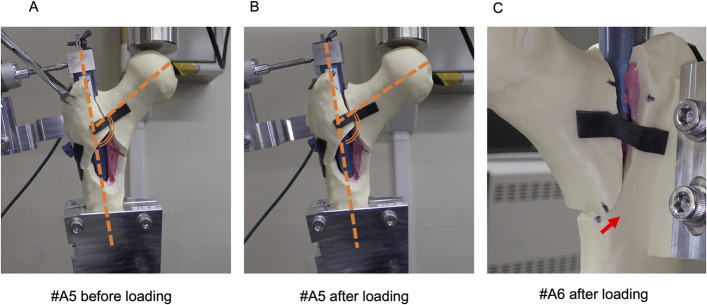
Fig. 5.
Figs. 5-A, 5-B, and 5-C Varus deformities were calculated with use of ImageJ2 software. We calculated the varus angles indicated by the bold dashed lines. The varus angle after loading (Fig. 5-B) was smaller than that before loading (Fig. 5-A), as shown for a representative fracture (A5). The measured displacement between before and after loading was calculated as the displacement of the medial cortex (Fig. 5-C), as shown for a representative fracture (A6). The arrow shows the displacement of the medial cortex.

