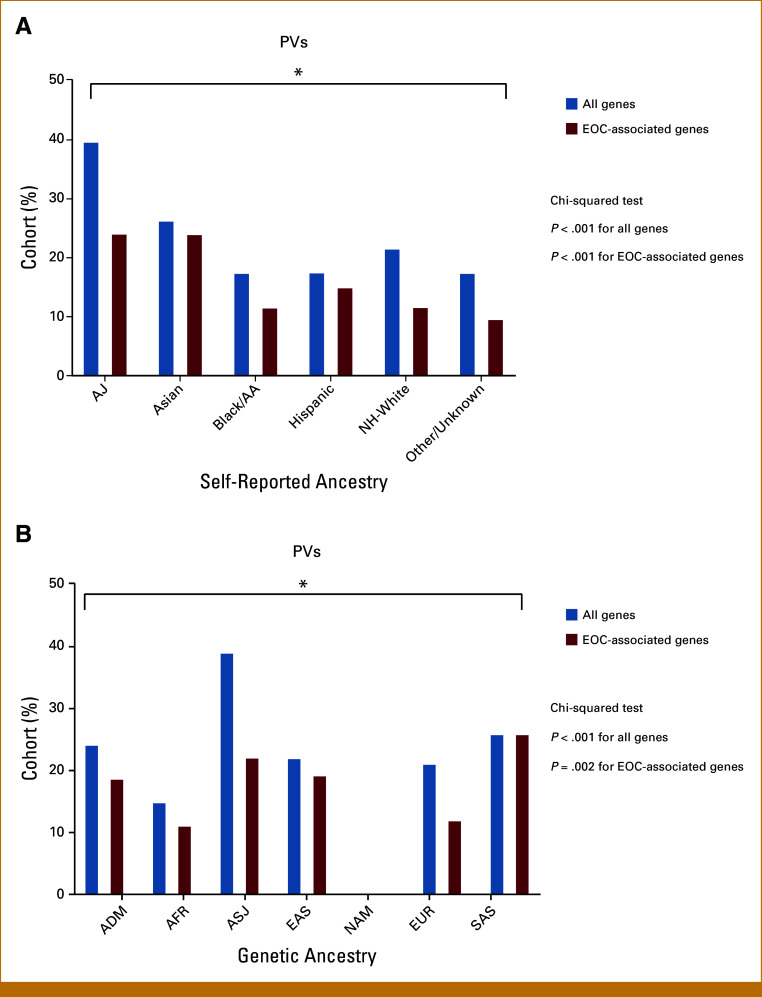
FIG 3.
Germline pathogenic variant by (A) self-reported ancestry and (B) genetic ancestry. (A) Rates of PVs in all assessed genes were high across all self-reported ancestries but were highest in the AJ and Asian populations (blue). When assessing EOC-associated genes only (red), rates of PVs continued to be highest in the AJ and Asian populations (24% each), and lowest in the Black/AA and NH-White groups (11% each). Rates of pathogenic/likely pathogenic variants differed between all groups for all genes and EOC-associated genes (P < .001). Other includes patients who self-identified as American Indian, Alaskan Native, Native Hawaiian, or Other Pacific Islander. (B) When evaluating rates of PVs across genetic ancestry admixture, similar patterns were seen, with high rates of EOC-associated genes in the ASJ, East Asian, and South Asian groups, and lowest in the African and non-AJ EUR groups. Notably, no pathogenic/likely pathogenic variants were identified in the two patients classified as NAM. Rates of pathogenic/likely pathogenic variants differed between all groups for all genes (P < .001) and EOC-associated genes (P = .002). AA, African American; ADM, admixed; AFR, African; AJ, Ashkenazi Jewish; ASJ, AJ genetic ancestry; EAS, East Asian; EOC, epithelial ovarian cancer; EUR, European; NAM, Native American; NH, non-Hispanic; PV, germline pathogenic/likely pathogenic variant; SAS, South Asian.

