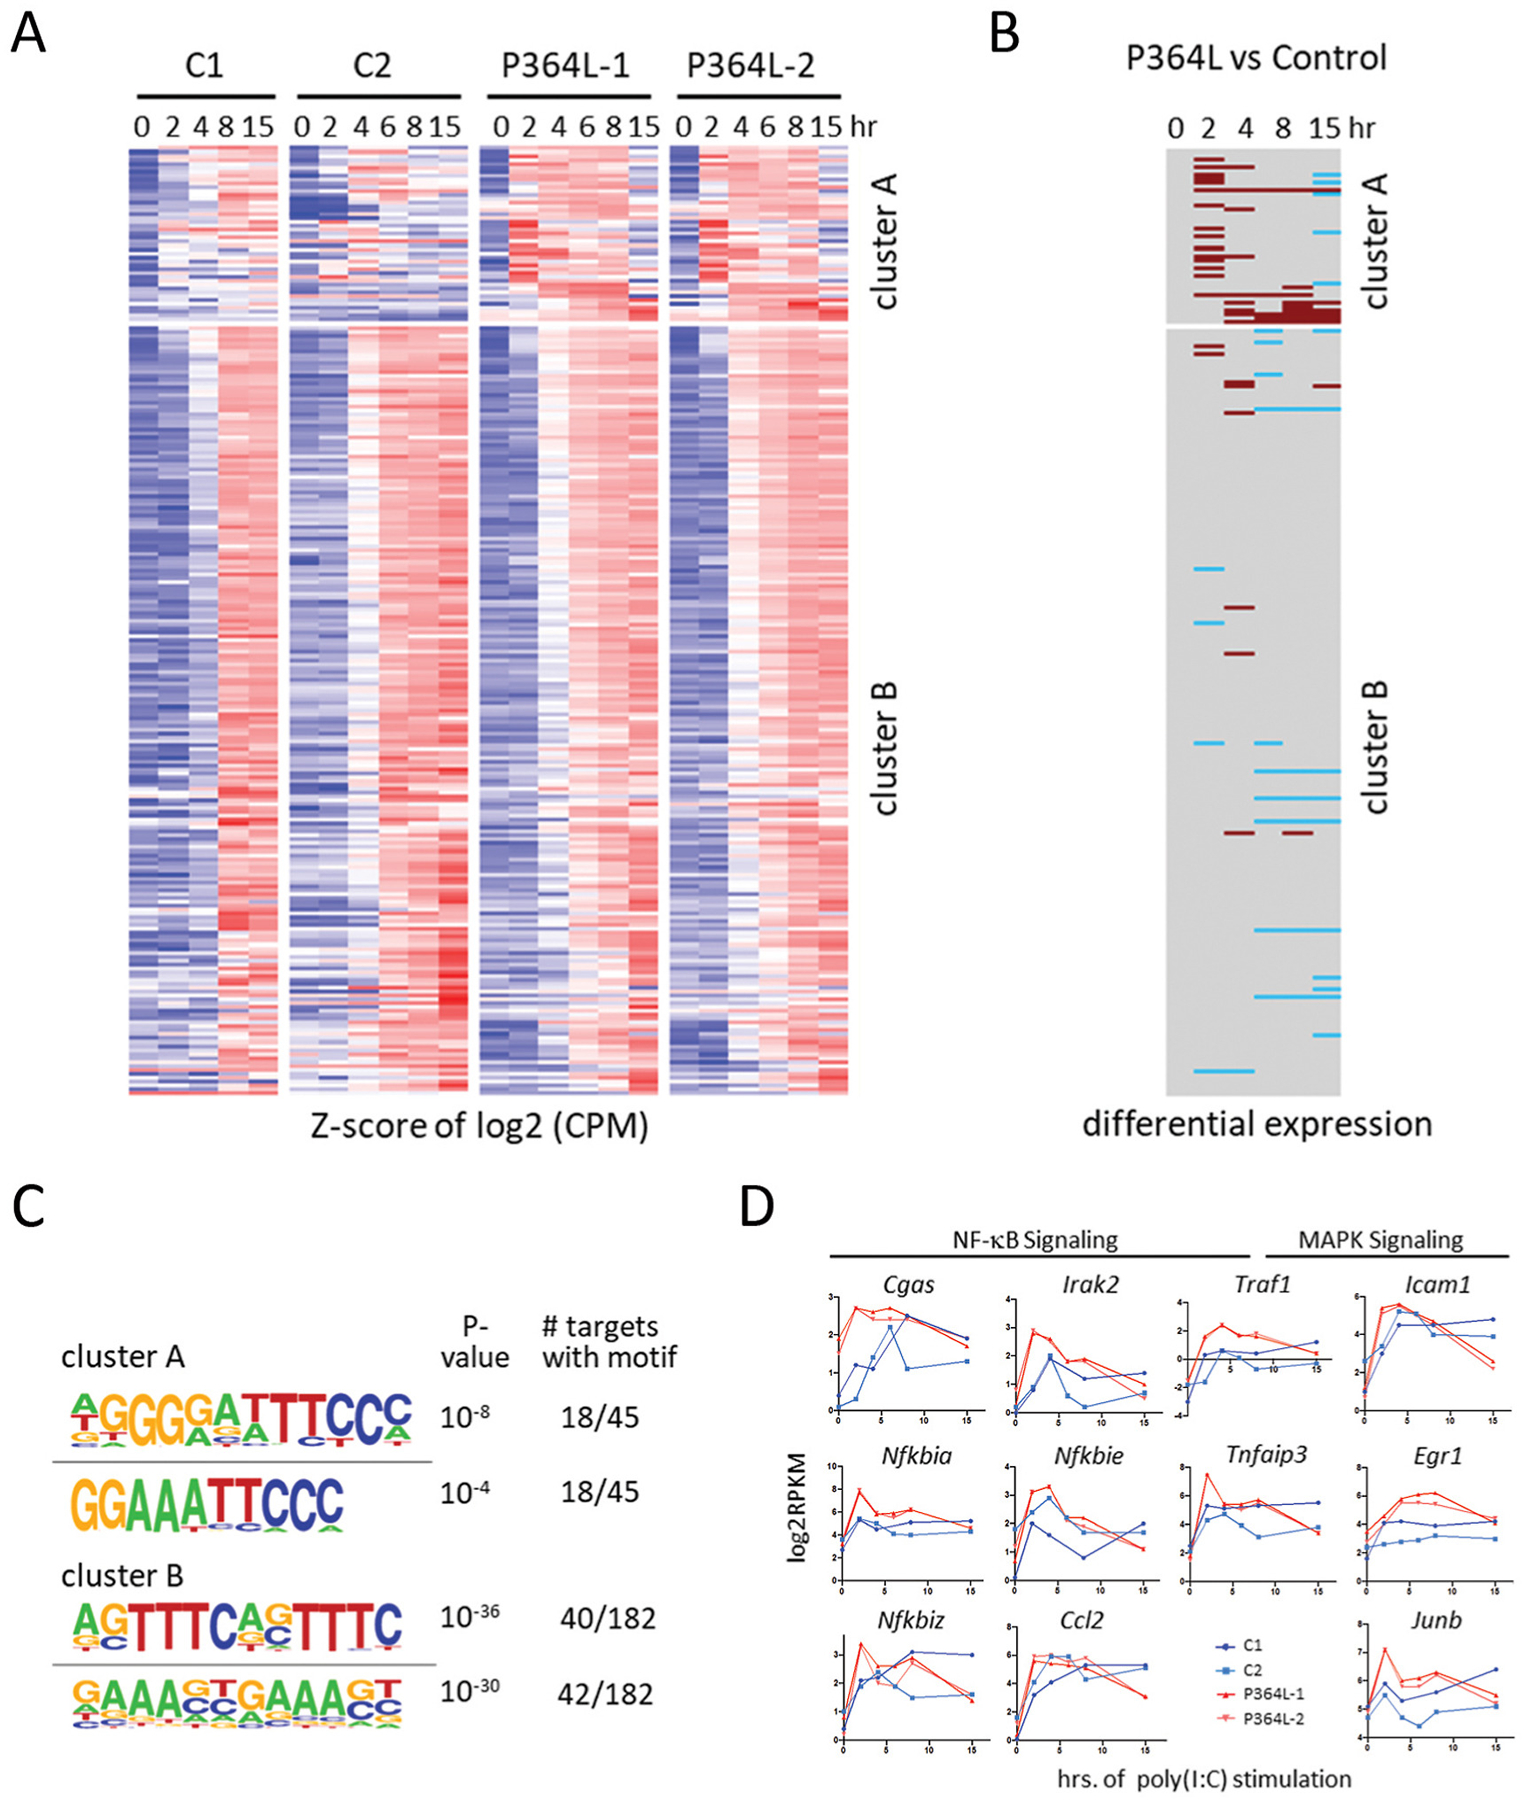
Figure 7. Elevated subset of NFκB transcripts in response to classical pathway activation.

(A) Heatmap of z-scored log2 transcript levels based on RNA-seq timecourse analysis of poly(I:C)-stimulated fibroblasts derived from indicated patients or healthy controls. Data was clustered by k-means into 2 clusters. (B) Genes and timepoints that show differential expression of >4 fold with a false discovery rate p-value of <0.01 are indicated. Hyper- and hypo-expression in patient fibroblasts is indicated in brown and blue, respectively. (C) Motif-analysis of regulatory regions (−1000 to +300 from TSS) yields the indicated top two motifs for clusters A and B. (D) Some of the genes in cluster A.
