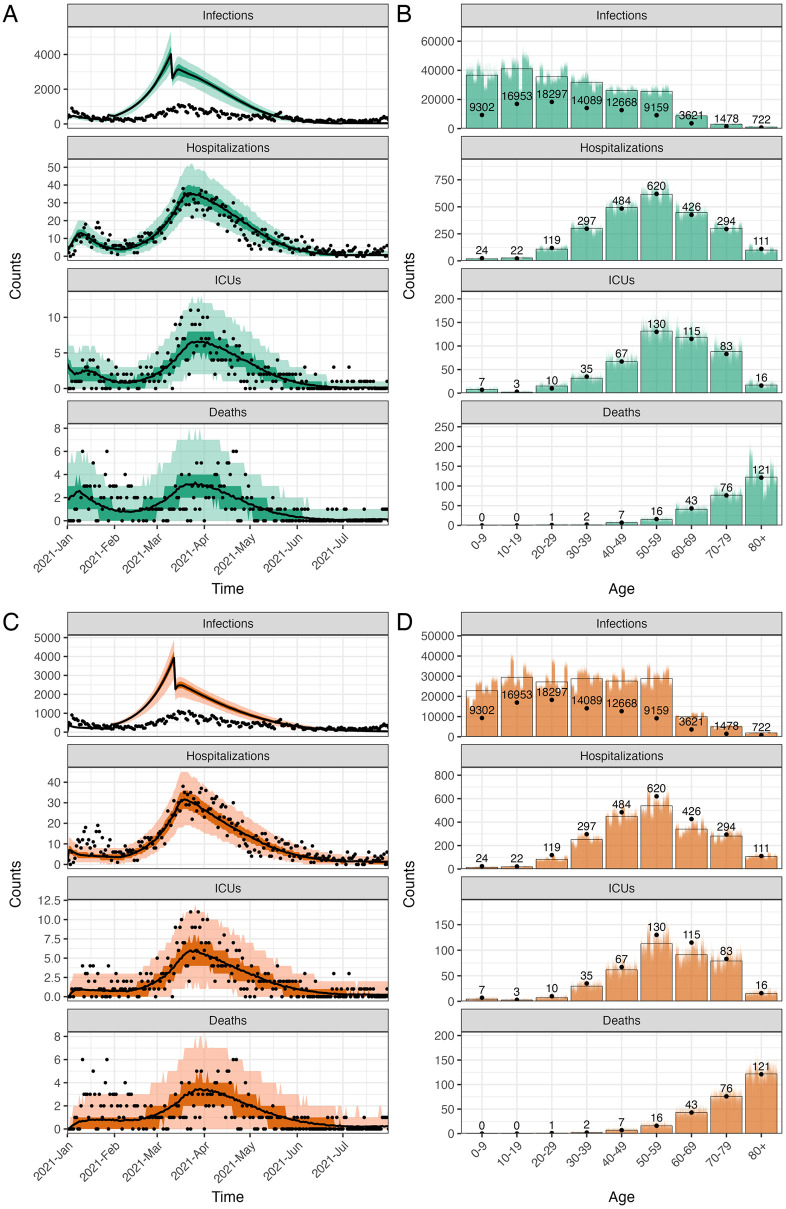
Fig 1. The calibrated individual-based model (IBM) and meta-population model (MPM) with data in the actual vaccination strategy.
The upper and lower panels show the IBM and MPM, respectively. A and C: The time series data of all ages. The lines show the model fits with their 50 and 95% prediction intervals represented by colored areas based on 1000 simulations. The dots show the observed data. B and D: The age distribution of total counts. Each of the 1000 colored bars shows the counts from one simulation and the full bars with black borders show the mean of all simulations. The data are shown in dots with their exact numbers. During the whole period, there were 86289 confirmed cases, 2397 hospital admissions, 466 ICU admissions, and 266 deaths registered.

