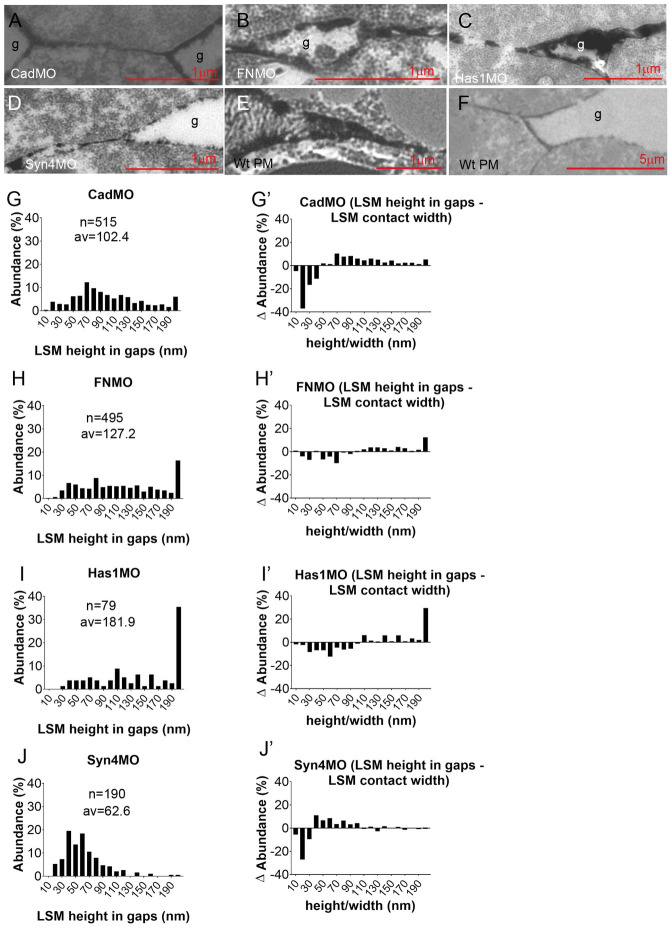
Fig 5. LSM in gaps.
(A–F) Examples of LSM at transitions from gaps (g) to cell-cell contacts. PM, prechordal mesoderm. (G–J) Frequency distributions of LSM height in gaps (corresponding to LSM width in contacts). n, number of measurements from 5, 6, 3, 7 TEM images, respectively; av., average. (G’–J’) Difference (ΔAbundance) spectra corresponding to (G–J), comparing LSM height in gaps to LSM width in contacts.

