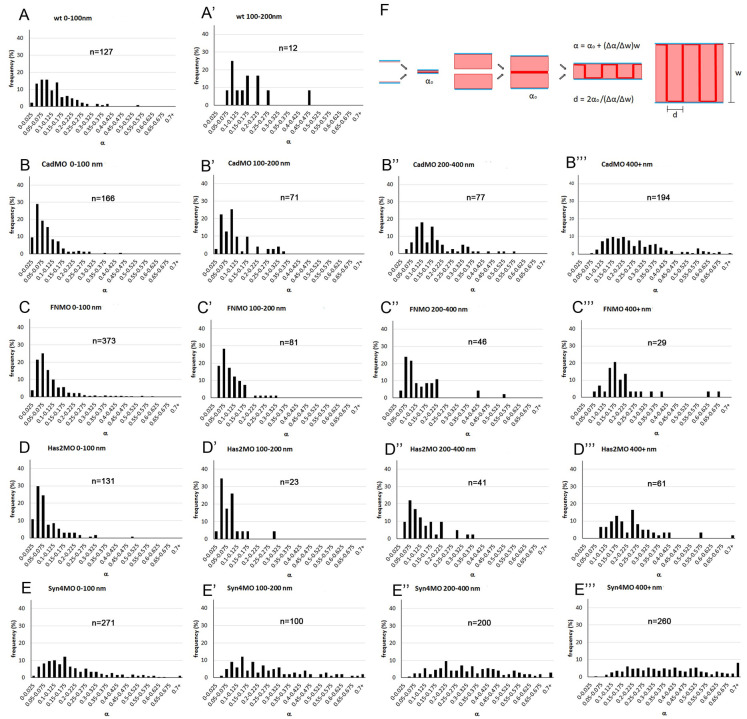
Fig 8. Frequency distributions of α values at different widths.
(A-E’’’) Different treatments are arranged vertically and width brackets horizontally, as indicated on top of each diagram. n, number of α-w data points. Additional width brackets are shown in S3 Fig (F) Model of cell-cell adhesion by PCM interdigitation. Adhesion between two thin or thick PCM layers (light red) on cell membranes (blue) occurs in principle through a narrow interaction zone (deep red), yielding in each case the basic adhesiveness α0 (left). Interdigitation of the two apposed PCMs corresponds to a folding of the interaction surface which increases linearly with PCM height w at constant interdigitation distance d (right).

