
Fig.3 |. 1H-MRS difference spectra and their quantification.
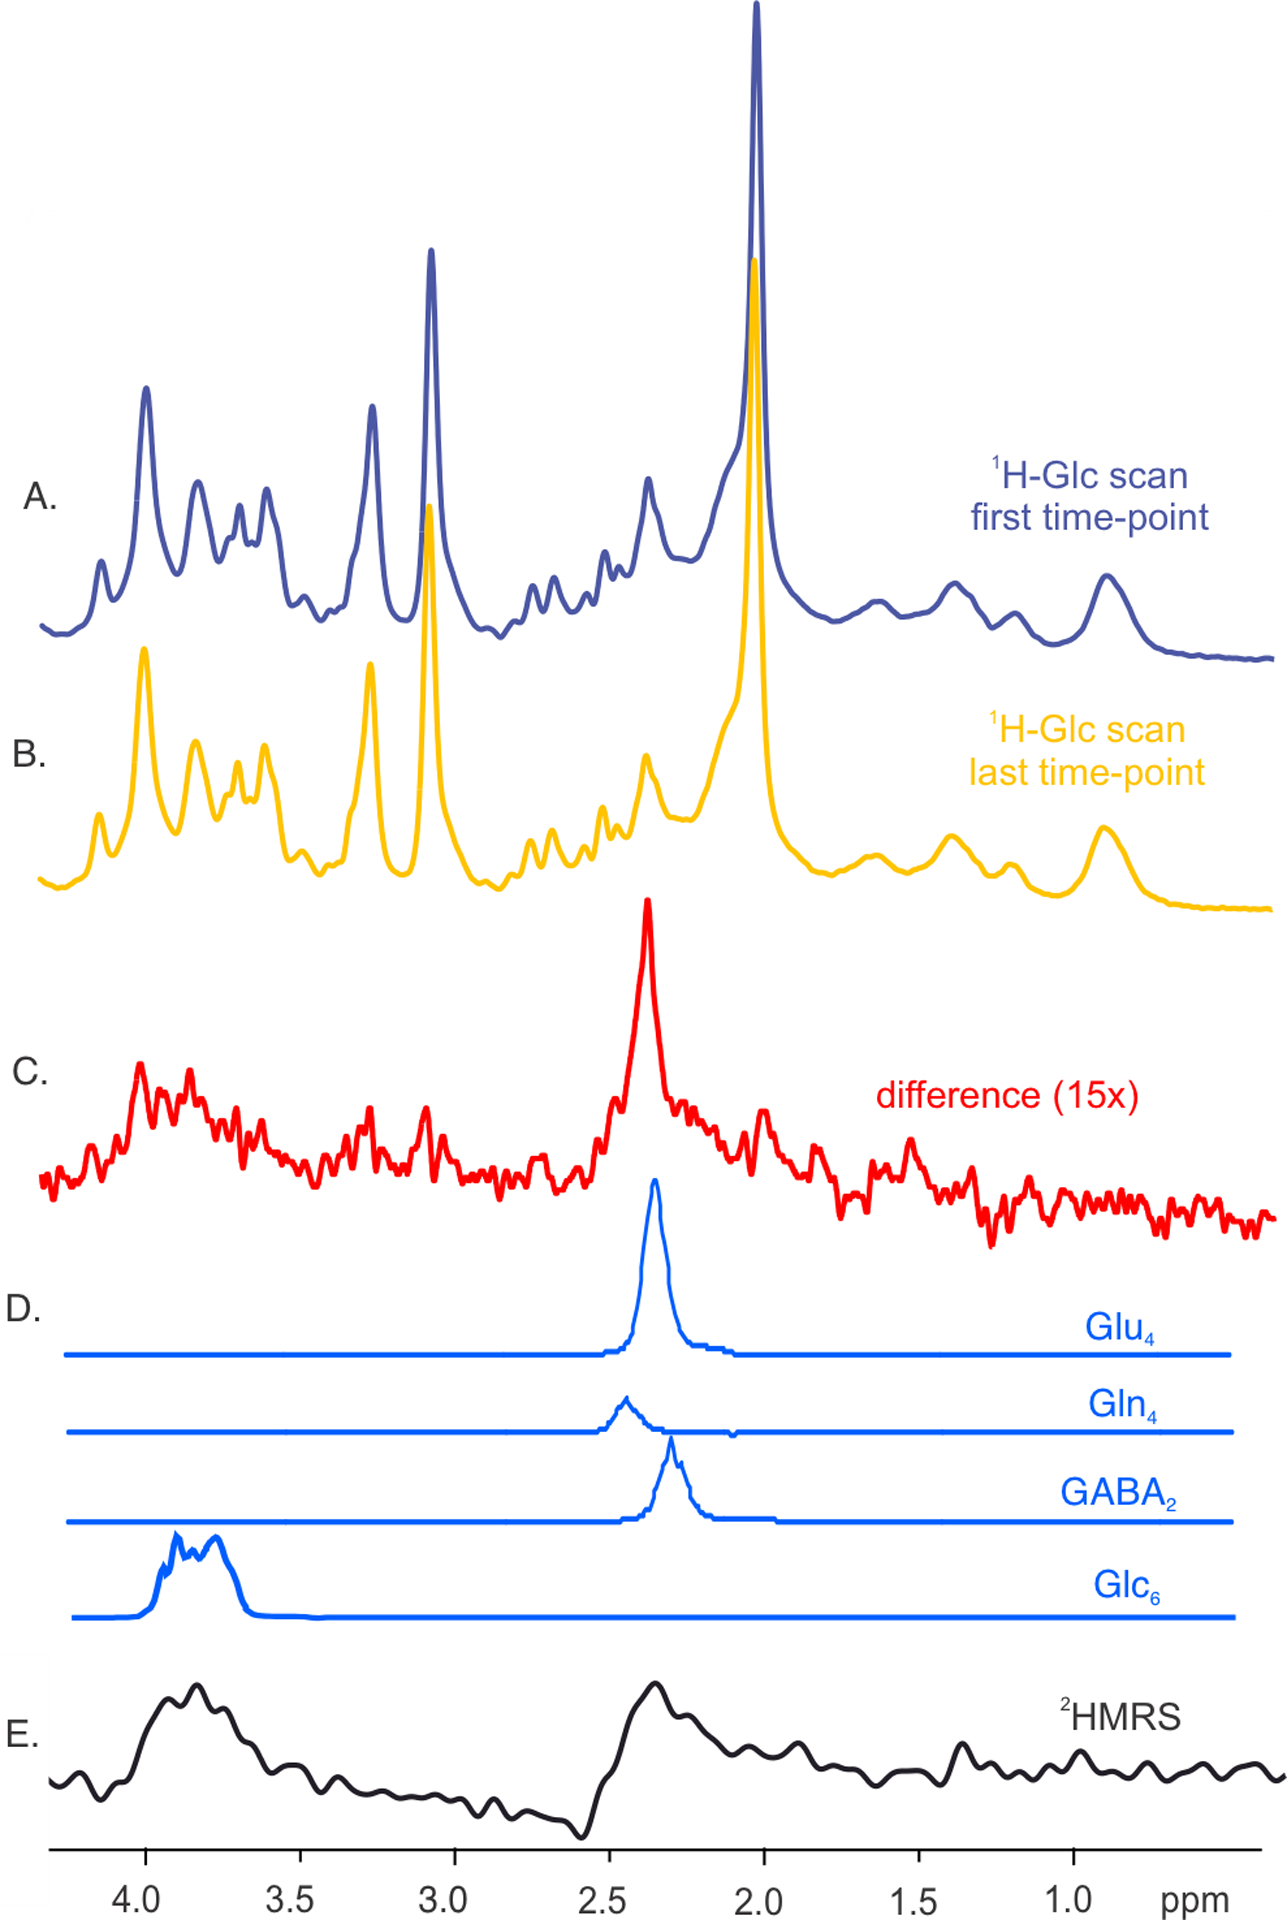
Summed spectra from all subjects (N=5) represent the first and last time-points after 2H-Glc ingestion. The spectra (A and B) were linewidth-matched with exponential line-broadening and subtracted. The resulting difference spectrum in panel C represents the effect of metabolite 2H enrichment. The metabolite components (D) were obtained via LCModel analysis using a basis set containing simulated spectra of neurochemicals that were undergoing deuteration (i.e., Glu, Gln, and GABA and Glc). The proton signals that originated from different carbon groups were separated. The summed 2H-MRS spectrum (N=5) from the last acquired time-point resembles the 1H-MR spectrum except for the spectral resolution (E).