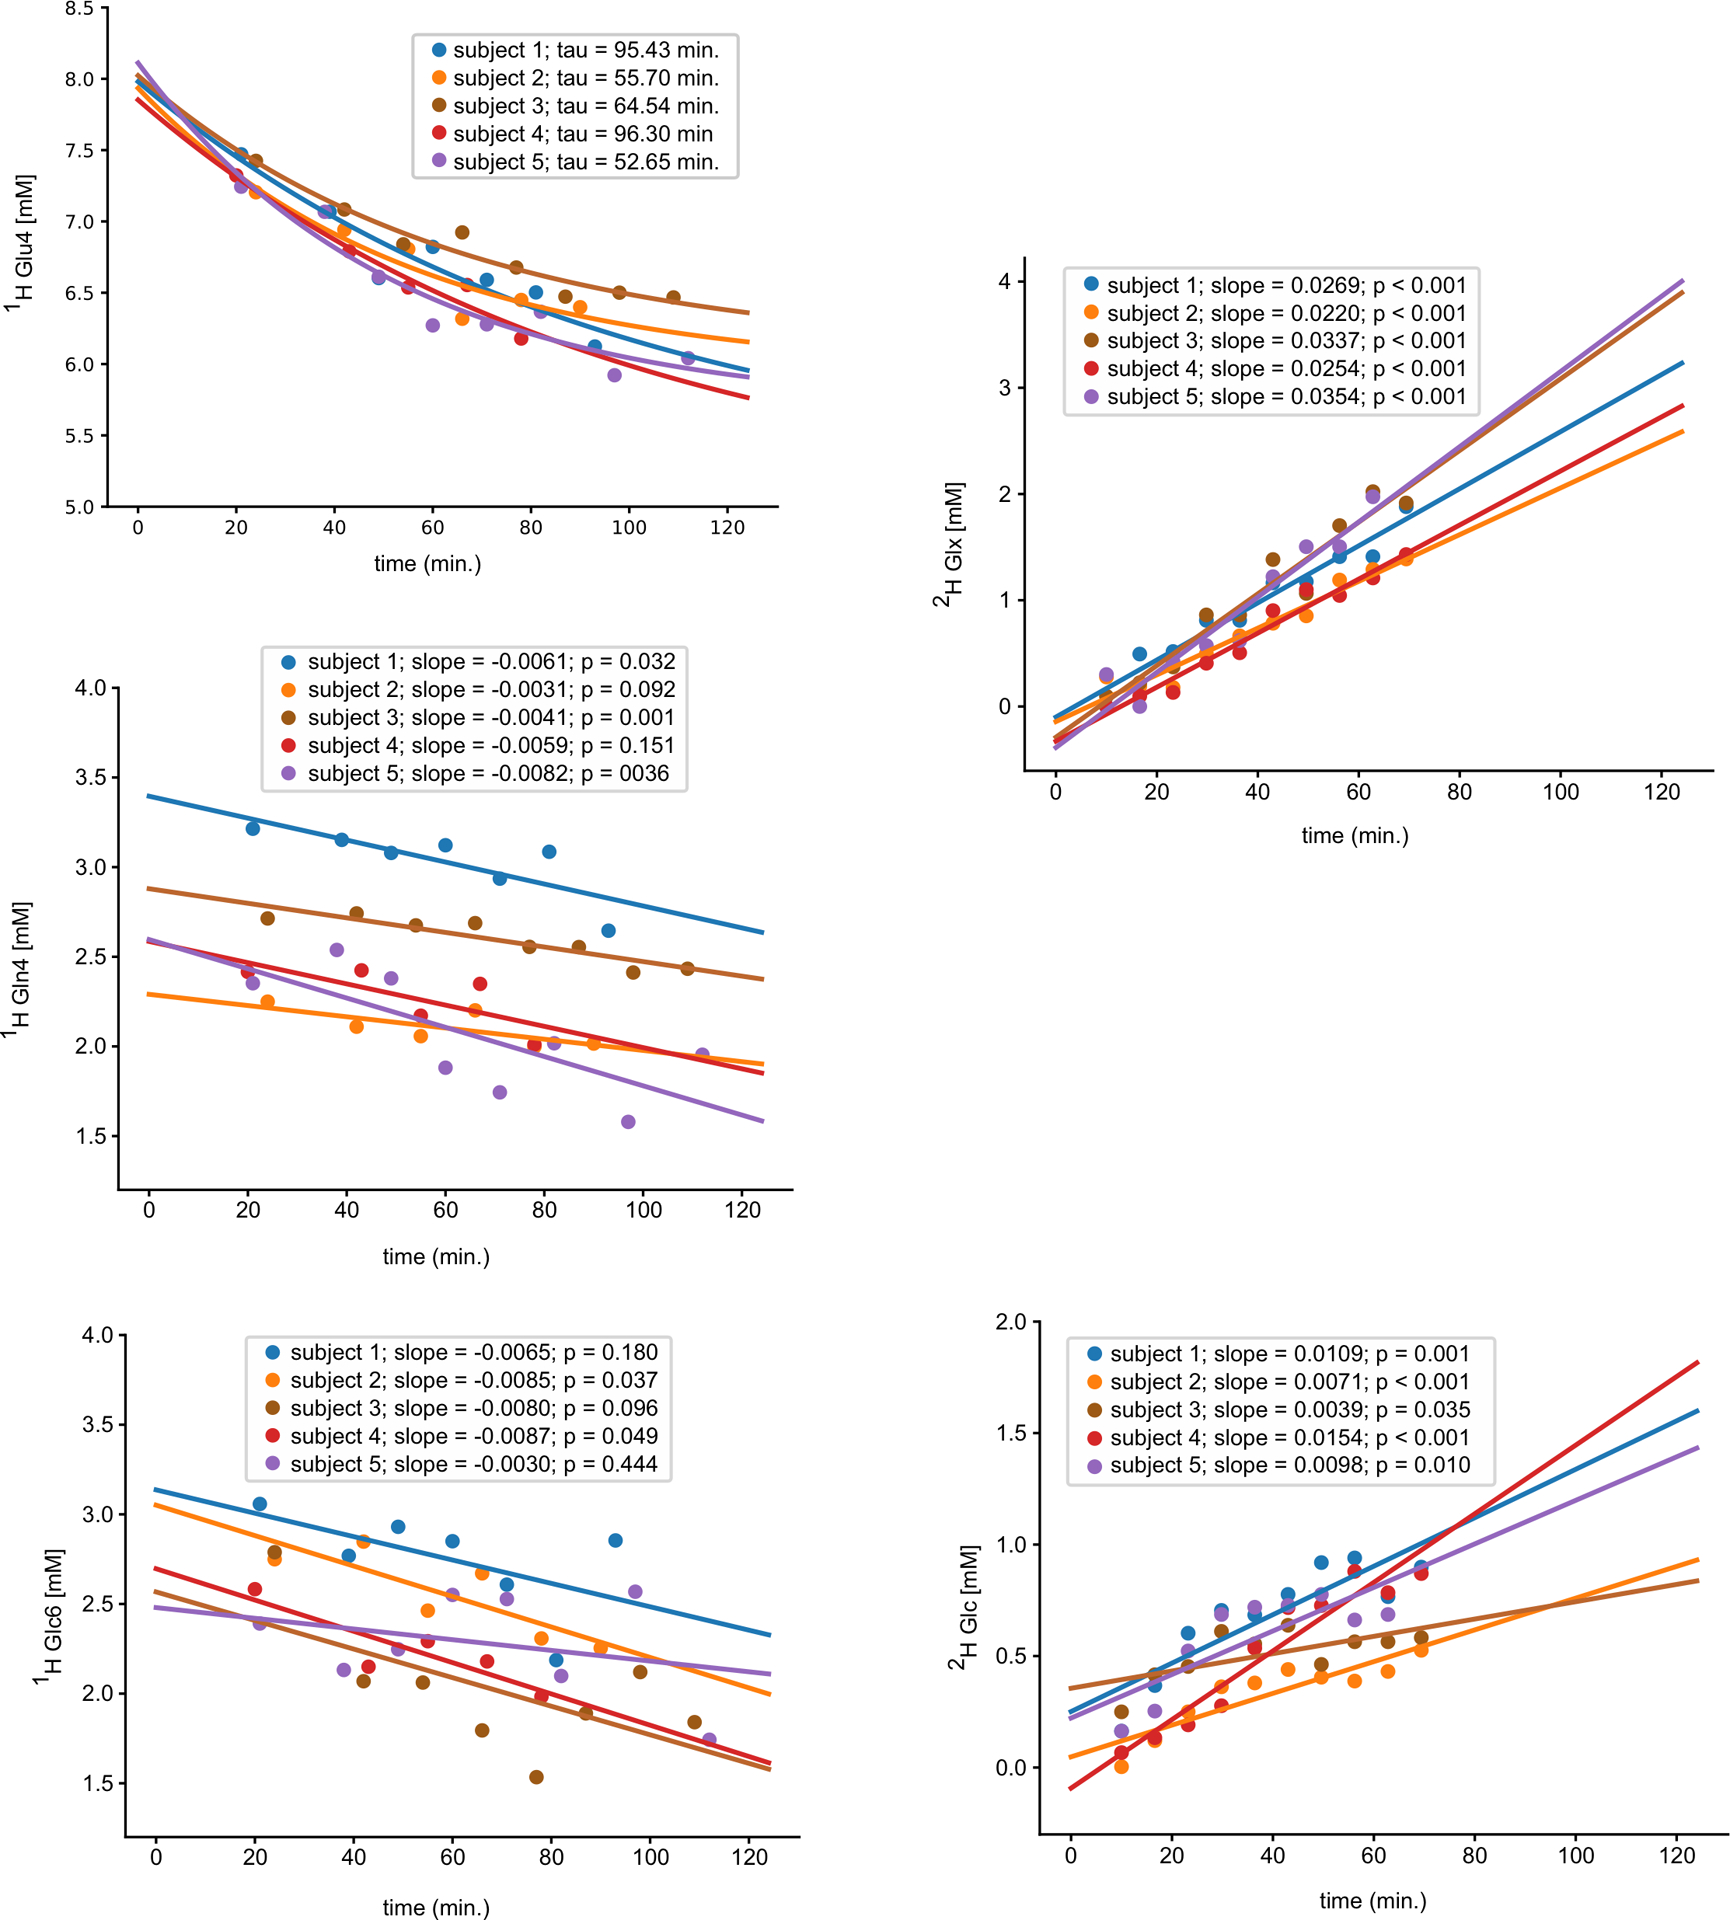
Fig. 4 |. Fitting of time courses obtained by quantification of 1H (left column) and 2H single-voxel MR spectra (right column).

The spectra were acquired in a single PCC voxel and concentrations were obtained by LCmodel. Decay in the concentrations of glutamate (Glu4) and glutamine (Gln4), glucose (Glc6), Glx (Glu+Gln) were fitted using the exponential function Y=Y0(−t/tau)+c (Glu4), and linear regression Y = a + bX (Gln4,Glc6, 2H-Glc, and 2H-Glx). The 1H-MRS time-courses and their fits following 2H-Glc ingestion are in line with those obtained by quantification of 2H-MR spectra. Two-tailed test was used to calculate significance of the slopes (p-values).
