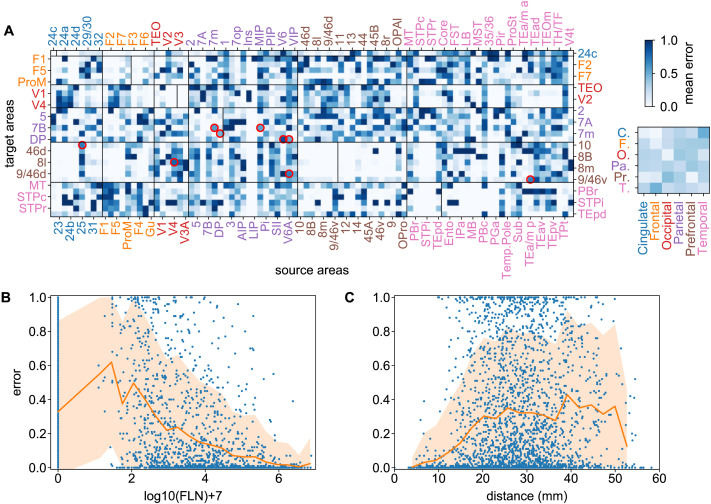
Figure 3. .
Binary prediction heterogeneity in the macaque brain. (A) Prediction error matrix for all known links (3-fold cross-validation) generated by gradient boosting (GB). Vertical lines within the main diagonal boxes, separate targets (to the left of the line) from noninjected areas (to the right of the line). Red circles indicate strong links (with weights > 5) with high prediction errors (ϵ > 0.5). Along with their weights w and their errors ϵ, these are: V6 → DP (w = 5.3, ϵ = 0.80), V4 → 8l (w = 5.1, ϵ = 0.72), 25 → 10 (w = 5.2, ϵ = 0.66), V6A → 9/46d (w = 5.3, ϵ = 0.65), TEa/mp → 9/46v (w = 5.3, ϵ = 0.65), MIP → 7B (w = 5.9, ϵ = 0.58), 7m → 7B (w = 5.3, ϵ = 0.57), DP → 7m (w = 5.1, ϵ = 0.52) and V6A → DP (w = 5.6, ϵ = 0.52). Inset matrix shows interregional errors obtained by averaging errors within submatrices corresponding to cortical lobes. (B) Prediction errors as function of link weights and (C) as function of link projection distance. The vertical line in panel B at 0 are all the node pairs for which the prediction was nonlink, while panel C contains all links and all nonlinks. The orange shaded areas in B and C represent one standard deviation from the average (orange line). The definition of error measure is given in the main text. Area abbreviations with corresponding area names and region assignments are provided in the Supporting Information Table S1.

