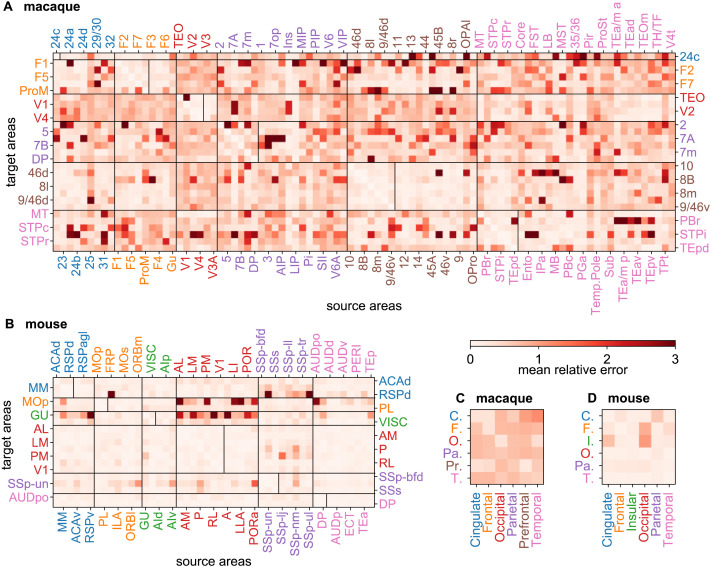
Figure 5. .
Prediction error heterogeneity for link weights. (A) Weight prediction error (defined as relative mean absolute error, RMAE) matrix for all known links with 3-fold cross-validation, in the macaque, generated by GB and (B) in the mouse. The vertical lines within the main diagonal boxes, separate targets (to the left of the line) from noninjected areas (to the right of the line). (C) interregional error matrix for the macaque (averaged from the matrix in A) and (D) for the mouse (averaged from the matrix in B). For nonlinks, the RMAE was calculated using the lowest statistically acceptable FLN value of 8 × 10⁻⁷ for the ground truth value (corresponding to a weight of w = 0.9). Area abbreviations with corresponding area names and region assignments are provided in the Supporting Information Table S2.

