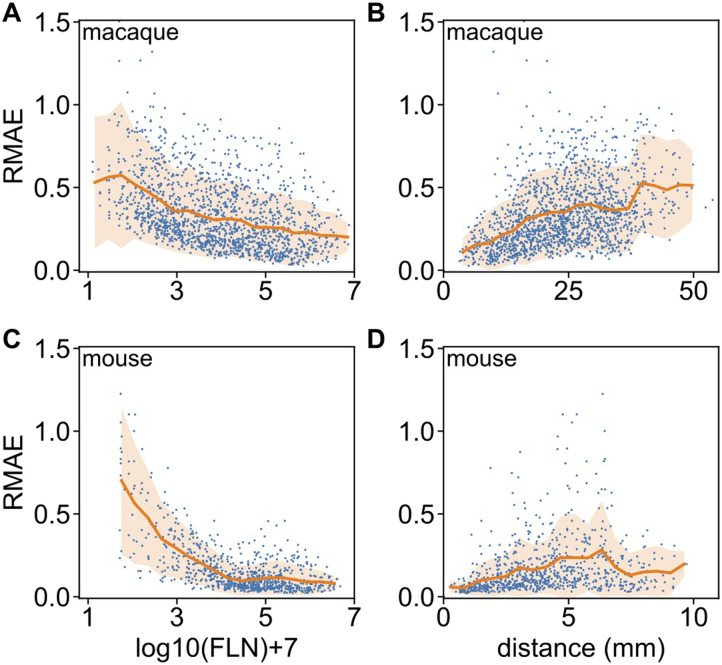
Figure 6. .
Weighted prediction errors as function of link strength and distance, using the prediction data from Figure 5. (A) Relative mean absolute error RMAE versus link weight and (B) versus projection distance in the macaque for every predicted link. (C) Same as panel A, and (D) same as panel B, for the mouse. The continuous line is the mean value, the orange shaded area corresponds to one standard deviation. Panels do not contain data for no connections.

