FIGURE 2.

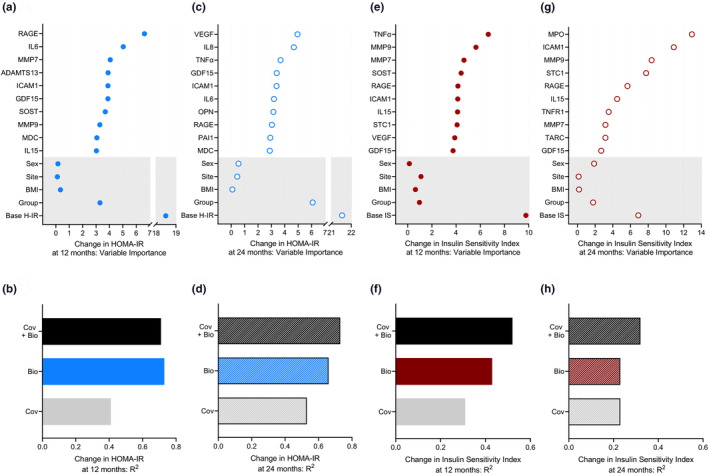
Changes in senescence‐associated biomarkers predict changes in HOMA‐IR and insulin sensitivity index at 12 and 24 months. (a, c) The relative importance of change in the top 10 biomarkers (12 months–baseline and 24 months–baseline) and of site, sex, BMI stratum (normal/overweight), intervention group (AL/CR), and baseline HOMA‐IR (base H‐IR) as determined by GBM to predict changes at 12 months and 24 months in HOMA‐IR. (b, d) The R2 of the GBM models—covariates (Cov) (sex, BMI stratum, site, intervention group, and base H‐IR) alone, top 10 biomarkers alone (Bio), or covariates plus top 10 biomarkers (Cov + Bio)—for predicting change in HOMA‐IR at 12 months and 24 months. (e, g) Variable importance summaries and (f, h) the R 2 of the GBM models for predicting change in the insulin sensitivity index at 12 months and at 24 months using the same covariates as above except for the use of baseline insulin sensitivity index (base IS) in place of base H‐IR. AL, ad libitum; BMI, body mass index; CR, calorie restriction; GBM, gradient boosting machine learning.
