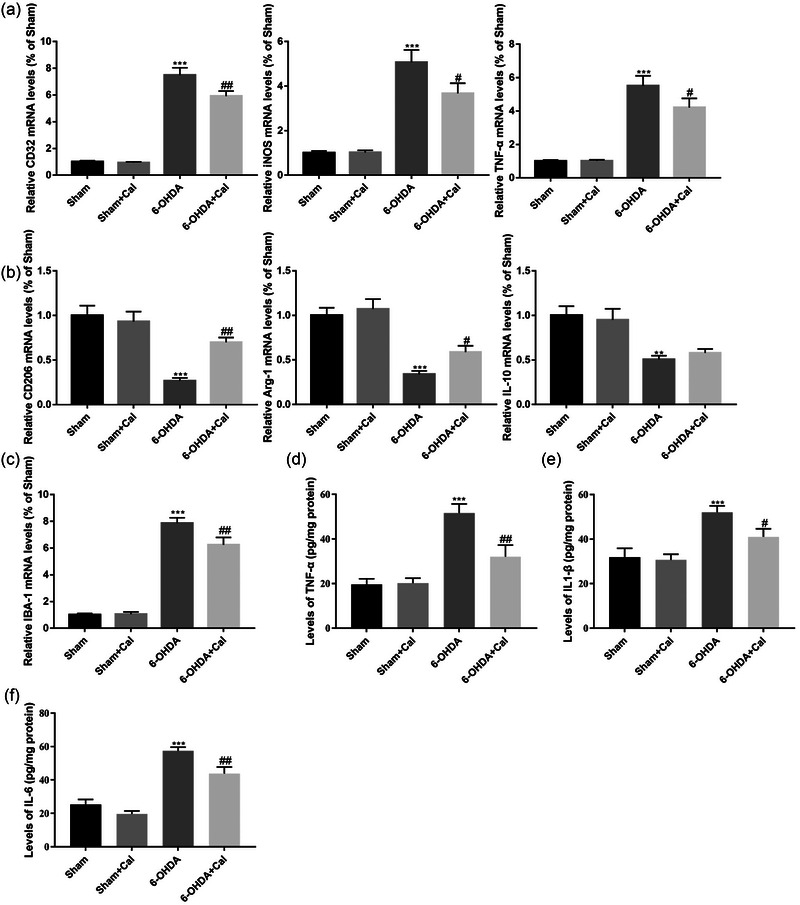
FIGURE 5.

Calcitriol regulated microglial M1/M2 polarization and reduced pro‐inflammatory cytokines release. (a) Relative mRNA expression of indicated microglial M1 phenotypic markers in mesencephalic tissues. (b) Relative mRNA expression of indicated microglial M2 phenotypic markers in mesencephalic tissues. (c) Relative mRNA expression of IBA‐1. (d) Levels of TNF‐α in mesencephalic tissues. (e) Levels of IL1‐β in mesencephalic tissues. (f) Levels of IL‐6 in mesencephalic tissues. n = 5 per group. **p 〈 .01, ***p 〈 .001 compared to the sham operation group. #p 〈 .05, ##p 〈 .01, compared to the 6‐OHDA injection group. Data were analyzed by one‐way ANOVA with Tukey's posttest.
