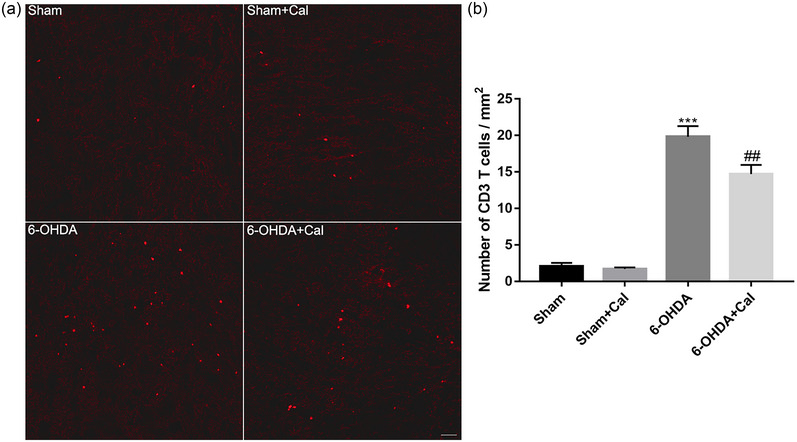
FIGURE 6.

Calcitriol pretreatment restrained T‐cell infiltration in the midbrain of the Parkinson's disease (PD) model. (a) Representative immunofluorescence staining for CD3 T cells in the midbrain. Every eighth serial section was selected for immunofluorescence staining. Scale bar 100 μm. (b) Bar graph showing the number of CD3+ T cells in the midbrain of indicated experimental groups. n = 4 per group. ***p < .001 compared to the sham operation group. ##p < .01 compared to the 6‐OHDA injection group. Data were analyzed by one‐way ANOVA with Tukey's posttest.
