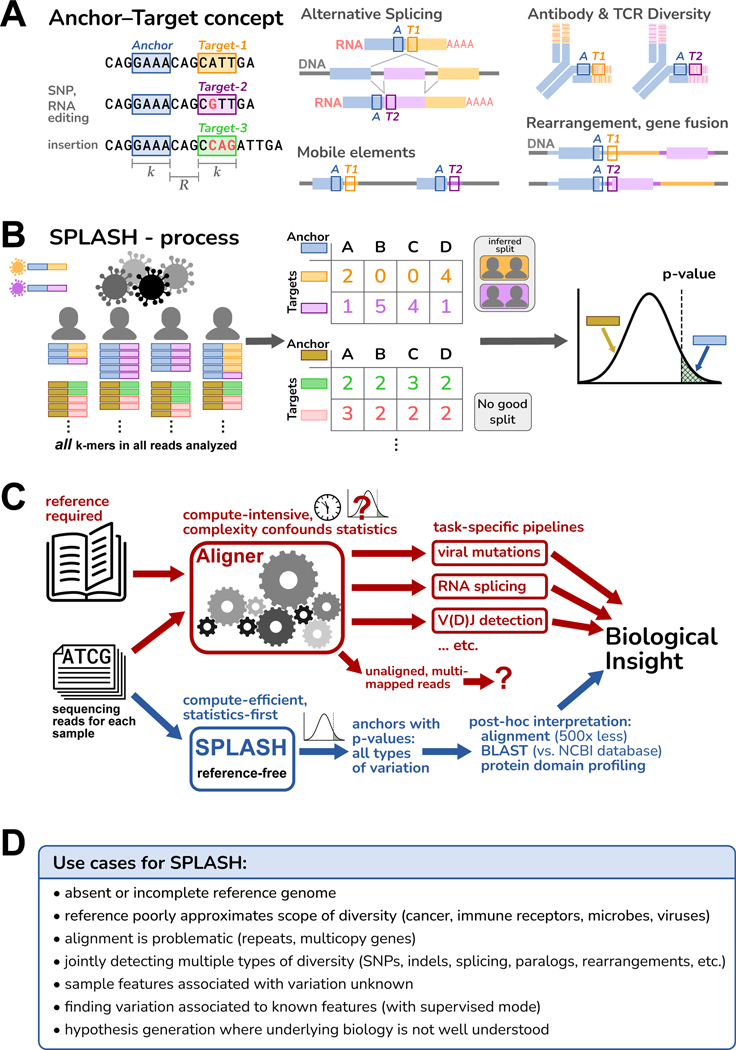
Figure 1. Overview of SPLASH.
A. An anchor is a sequence of length (-mer) in a read; its target is the -mer that follows it after a fixed offset of length . An anchor may occur with different targets, which can capture many types of variation; examples are depicted schematically, with the anchor as a blue box and the targets as orange or violet boxes.
B. SPLASH compiles a table for each anchor, where the columns are samples, the rows are targets, and the entries are the respective occurrence counts. SPLASH tests multiple random splits of the samples, calculating a test statistic that measures the deviations between each sample’s target distribution and the average target distribution over all samples, searching for the most discriminating split. For the best split identified, SPLASH reports a -value bound.
C. Alignment-based pipelines are limited by the need for a reference genome, compute-intensive, and difficult to model statistically due to their complexity. SPLASH detects variation directly from raw reads with rigorous statistics, is compute-efficient, and detects many kinds of variation at once.
D. Some considerations of when SPLASH may be most useful, which reflect its design characteristics.

