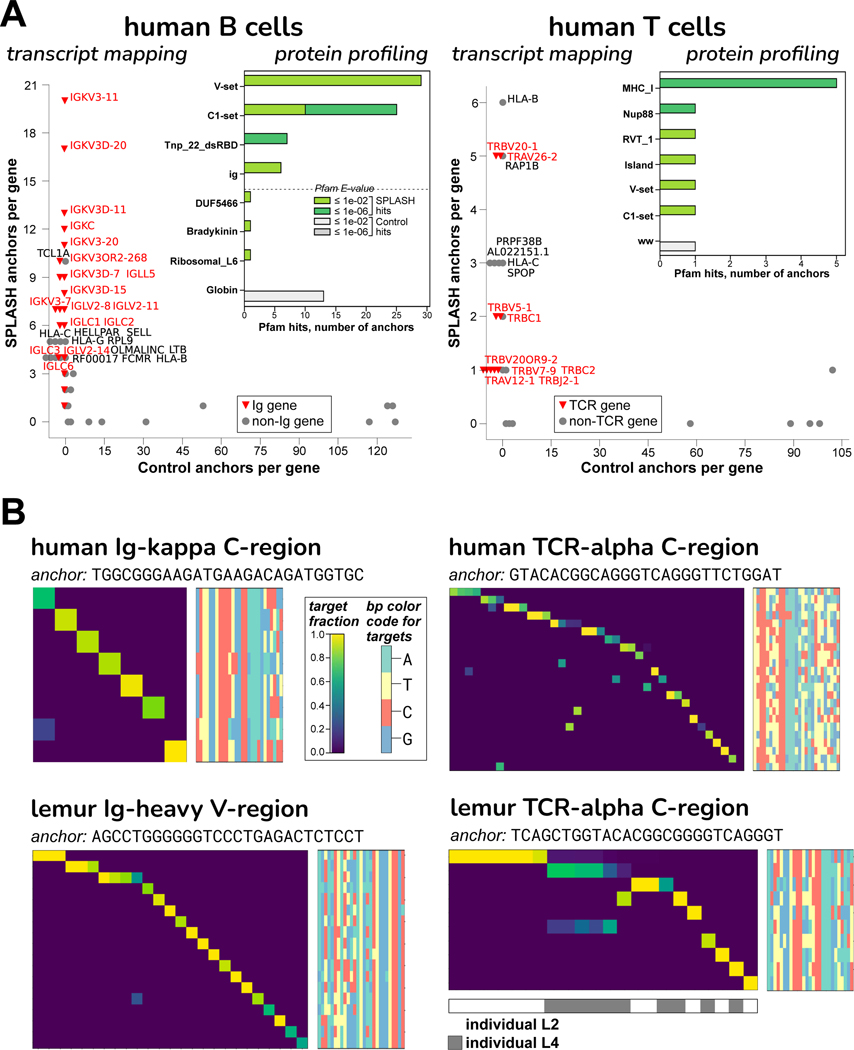
Figure 4. B and T cell receptor diversity from human and lemur single cell data.
A. The “transcript mapping” plots show the number of anchors that align to a given gene name, for SPLASH on y-axis and Controls on x-axis, with immune receptor genes highlighted in red. For B cells, Ig genes (kappa = IGK and lambda = IGL) predominate among SPLASH anchors, but are not found at all in Control anchors. For T cells, TCR genes (alpha = TRA, beta = TRB) predominate, and are not found in Controls. The inset histograms show that immunoglobulin-type “V-set” and “C1-set” are among the top protein domain annotations identified by Pfam on anchor consensuses (for B cells, the top four and bottom four domains are shown; for T cells, all domains are shown). Mobile element activity is suggested by Pfam domains Tnp_22_dsRBD (“L1 transposable element dsRBD-like domain”) in B cells and RVT_1 (“Reverse transcriptase”) in T cells.
B. Targets associated with Ig/TCR anchors are clonotypically expressed, in both human and lemur: heatmaps show that most targets (rows) are expressed only in a single cell (columns). Target sequences are shown as bp color-maps (rows are targets, matching the heatmap; columns are bp positions, colored by base), for quick visualization of sequence diversity. Lemur NKT cells show shared TCR usage – see top two rows; the shared target sequence is different in the two individuals.

