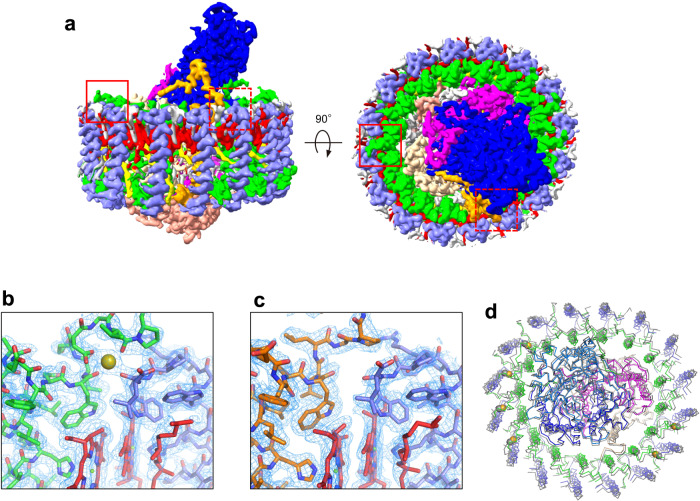
Fig. 1. Overall structure and cofactor arrangement of the Alc. vinosum LH1–RC complex.
a Side and top views of surface representations of the LH1–RC parallel to the membrane and from the periplasmic side of the membrane, respectively. b A typical Ca2+-binding site (marked in a by the red rectangle) with the density map around the C-termini of LH1 α1(green)- and β3(slate blue)-polypeptides. Ca2+ bound to LH1 is shown by an olive sphere. c A typical Ca2+-free site (marked in a by the red dashed rectangle) with the density map around the C-termini of LH1 α3(orange)- and β1(slate blue)-polypeptides. d Overlap view of the Alc. vinosum LH1–RC (colored) and that of Alc. tepidum (gray, PDB: 7VRJ) by superposition of Cα carbons of the RC-M subunits. Color scheme: LH1-α, green; LH1-β, slate blue; RC-L, wheat; RC-M, magenta; RC-H, salmon; RC-C, blue; BChls, red; carotenoids, yellow; lipids, gray.

