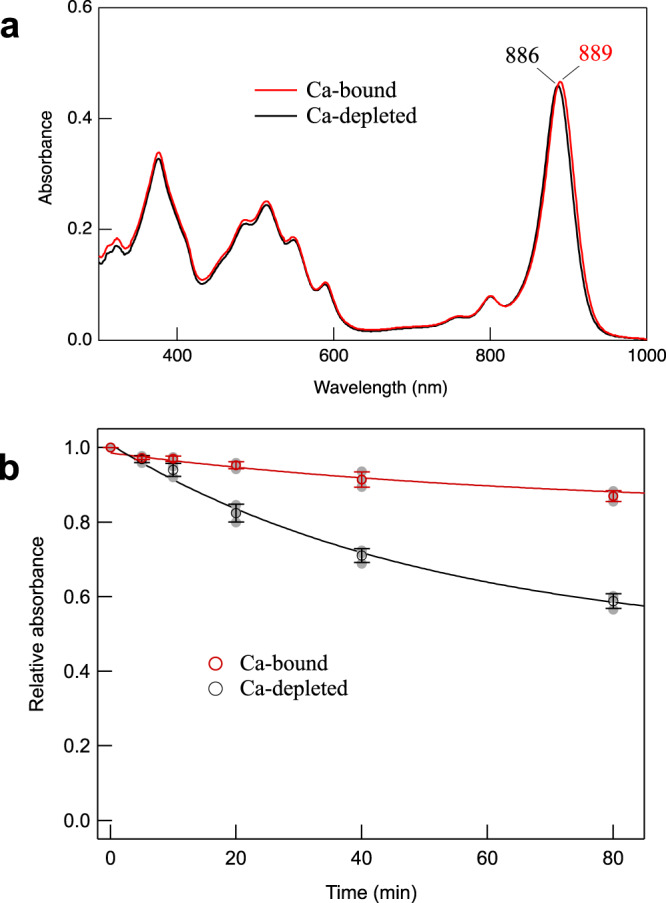
Fig. 4. Absorption spectra and thermostability of the Alc. vinosum LH1–RC complex.

a Absorption spectra of the sucrose-density purified LH1–RC complex treated with 20 mM EDTA in 20 mM Tris-HCl (pH7.5) buffer containing 0.08% w/v DDM followed by removing the EDTA (Ca2+-depleted, black curve) and then adding 20 mM CaCl2 (Ca2+-bound, red curve). b Time course of the relative LH1-Qy intensities upon incubation of the Ca2+-depleted and Ca2+-bound LH1–RC complexes at 60 ˚C. Gray points indicate raw data.
