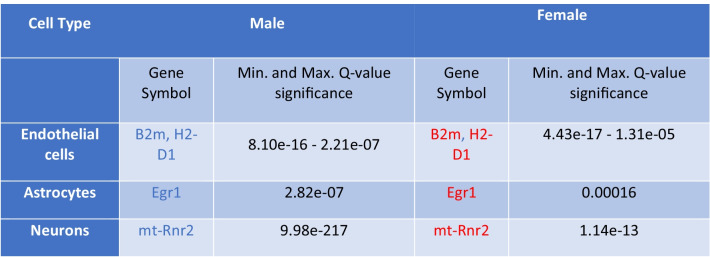
Table 3.
Gender-dimorphic DEGs
Table of the most significant gender-dimorphic DEGs (Q value < 0.05), i.e., significantly differentially expressed in both genders (male and female) but with an opposite log. fold-change per cell type, in Tg2576 mice compared to WT controls. Genes with increased or decreased expression compared to WT controls are represented by red and blue color, respectively. The complete lists of DEGs across all cell types are provided in the Supplementary Table S2

