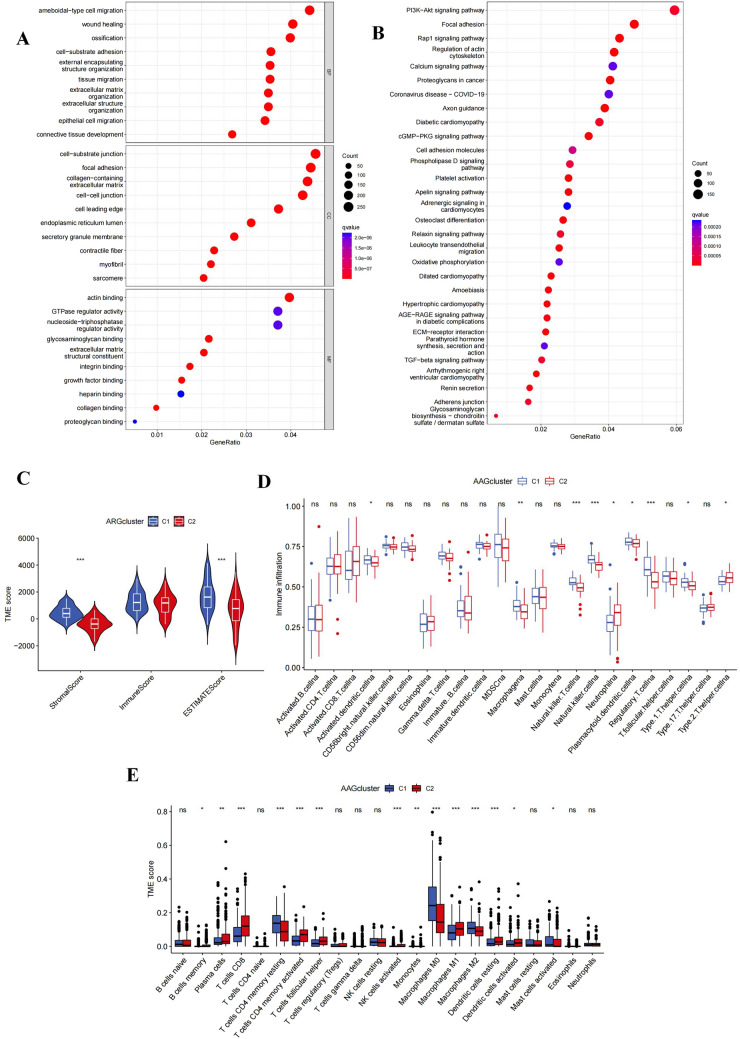
Fig. 2.
HNSCC clusters based on angiogenesis-related DEGs. A, B GO and KEGG enrichment analysis of DEGs in two HNSCC clusters; C Two HNSCC clusters Correlation between group and TME score; D ssGSEA calculated the abundance of 23 infiltrating immune cell types in two HNSCC clusters; E CIBERSORT calculated the correlation of 22 immune cells and TME scores between cluster 1 and cluster 2 patients Difference (*p < 0.05; **p < 0.01; ***p < 0.001)

