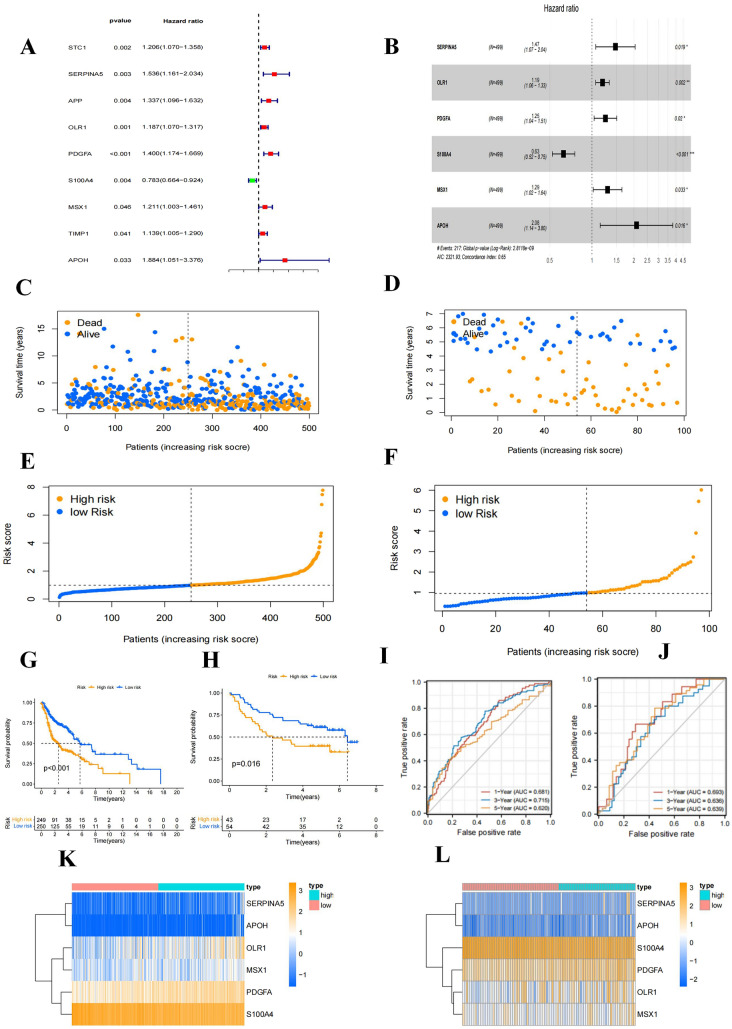
Fig. 5.
Construction of HNSCC prognostic signature. A Forest plot showed that the prognosis related AAGs were preliminarily obtained by univariate regression analysis; B Forest plot showed that the AAGs used to construct the prognosis model was further determined by multivariable regression analysis; C, D Scatter plot of risk score distribution and patient survival status in the training and validation cohorts, respectively; E, F Ranking plot and median value of risk score in the training and validation cohorts, respectively; G, H Kaplan–Meier analysis comparing OS between high- and low-risk groups in the training and validation cohorts, respectively; I, J ROC curves reflecting the sensitivity and specificity of the signature for predicting 1-year, 3-year and 5-year survival in the training and validation cohorts, respectively; K, L Expression pattern comparison of the six selected prognostic genes used to construct the signature between the high- and low-risk groups in the training and validation cohorts, respectively

